| The Not So DAILY BULLETIN 4 December 2023 No.600 |
| Top Stories |
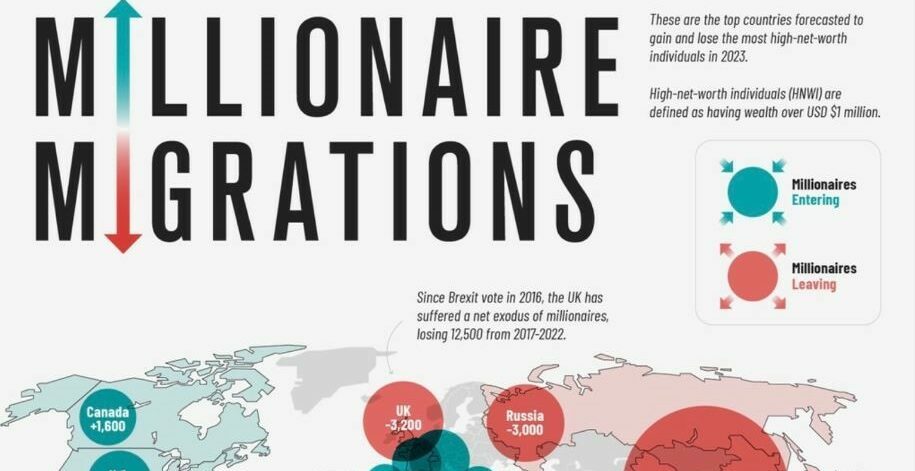
| 600th Not So Daily Bulletin! 443 written under Provincial Wealth since 18/10/2018 when the ASX was at 5942. Monday, 4 December 2023, the ASX 200 gained 52 points or 0.7% to finish at 7125 (highest point since 21 Sept). The markets are feeling Central Banks are on pause and are even starting to price in rate cuts as early as next year. We aren’t on that page (rate cuts), and if Central Banks do cut in the first half of 2024, it’s because the economy is in recession, and that’s not a good thing. US Federal Reserve chair Powell said on Friday that any rate-cut discussion is “premature”. Our Investment committee is meeting in Deni on Thursday with chairman Brad Matthews visiting Deni, so that we will update the outcomes of that meeting on Friday. One market that keeps on defying logic is the Australian residential housing market. In the face of rising interest rates, prices have moved higher. This suggests that interest rate rises aren’t impacting the buyers. This has seen cash-only buyers (not borrowing money) as the most significant buying group. As we know, immigration is very strong this year, with 500k plus coming to Australia. The chart below may explain why prices have maintained these heights. It shows the movement of global millionaires, with Australia having the highest number of millionaires migrants, 5,200 in 2023. We lost this title to the UAE in 2022, as we held this position from 2015-2019. Cash-up buyers are certainly supporting the market, especially when there is a shortage of accommodation. Other events this week – RBA is expected to be on hold tomorrow. KEVIN is calling a HOLD. – Australia’s GDP on Wednesday. Expecting a small positive. – US employment on Friday, expecting 180,000 jobs created. WE ARE STILL CAUTIOUS in the short term but are moving back to our favourite saying, BUY THE DIP. We are happy for you to share our Not So Daily Bulletin with family and friends, and if we can help them, we are also happy to chat. |
 |
| November market review After three months of sliding markets, we finally saw a strong rebound in November. There were two main reasons. 1. Seasonal – November is historically a strong month, especially when coming off the back of a lower October & 2. Markets sensed Central Banks are finished raising interest rates and a falling Bond market assisted in this conclusion with 10 year Bond rates falling up to 0.5% during the month. This saw a rally in all the major global markets apart from Hong Kong which had a slight fall. The best performers were the US markets and Japan, with the NASDAQ up 10.7% for the month. The NASDAQ holds the best performer title for all the time periods in the graph below 1 month, 6 months 1, 5 10, 15 and 20 years. First time I can recall that happening in 600 bulletins. Over 6 months and 12 months, most markets are positive with 12 better than 6, but the ASX has struggled and has we have been suggesting, has been trading sideways for a year. |
 |
| Global growth for 2024 I have summarised Citigroup’s updated view of the global economy for 2024. 2023 Global growth is 2.6%, which was better than expected. (expectations were sub-2% growth and “rolling recessions.”) Inflation has fallen while employment remains tight. These surprises have increased the probability of a soft landing for the global economy. However, the journey isn’t over and the “last mile” of the global inflation fight is likely to be a tough slog. Citigroup expects the lag effect of interest rate rises will have an effect on the labour market, with unemployment rising and slower economic growth in 2024. Developed Markets (DM) economies are likely to see several falling into recession Figure 6 shows UK, Sweden, Canada and Euro Area -EA. Offsetting this is still strong growth from China 4.6% India 5.7% and Indonesia 4.9%. Citigroup sees global growth in 2024 retreating to 1.9% before rebounding to 2.5% in 2025. The heart of the global economy’s resilience has been a self-reinforcing dynamic between strong consumer spending and tight labour markets. Coming out of the pandemic, global consumers had pent-up demand. The strong spending, in turn, increased demand for workers, with the unemployment rate falling and wages growing. The tight market and strong wage growth, in turn, have further fueled consumer spending. Citigroup believes the path of services inflation in the year ahead is the key (we would agree) As shown in Figure 8, Goods inflation has dropped very quickly as this was probably the transitory inflation that the US Federal Reserve believed was the main driver of inflation, but it’s the course of services inflation (wages and rents) that will shape the economic views over the next year. The restrictive interest rates, coupled with an expected step down in global services spending, will allow services inflation to gradually cool. If not, central banks will be faced with the unpleasant prospect of maintaining tight policies for longer than expected or, perhaps, even hiking further. Each major area (US, China & Europe) has unsynchronized from each other over the last year. A major question is the extent to which this desynchronization continues in 2024?—With the envisioned slowing in global growth—and a projected US downturn—cyclical performance is likely to become more similar. Citigroup notes a raft of elections will have an impact on the global economy in 2024.—Elections will be held this year in countries including Taiwan (January), Russia (March), India (April-May), the United Kingdom (likely April or May), Mexico (June), the European Parliament (June), Venezuela (H2), and the United States (November). The outcome of these elections will influence the tone and trajectory of economic performance in these countries and frame major features of the geopolitical landscape. |
 |
 |
| What works after the RBA pauses? There is a growing view that either the RBA has finished or there is one more rate hike (February). Macquarie has penned a research piece discussing what companies benefit from a pause in rate hikes. • Hikes all but done. The US Fed’s last hike was in July, and except for Australia, the last hike in the developed world was in September. These pauses suggest central banks increasingly see the risks shifting from high inflation to slowing growth as they wait to see the lagged impact of past hikes. While there is still a risk of another RBA hike in February 2024, market movements last month suggest investors are positioning as if the RBA is done. • Pauses a short-term relief. In the current inflation-targeting regime, the RBA paused four times before a pivot to easing. This includes two cases for which a US recession (2000, 2008) and two soft landings (1995, 2010) followed. A pause often drives a relief rally in equities as cost of capital headwinds ease. • What works after a pause? Bond yields typically fall after a pause, which drives the outperformance of bonds over stocks. Whether a soft landing or a US recession, the slower growth that drives central banks to pause (and later ease) also tends to drive the expectation of earnings downgrades and the outperformance of defensives over cyclicals. Health, Staples and Gold outperformed after an RBA pause when there was a US recession, with earnings growth usually the key driver of their outperformance. • Past outperformers. There are some stocks that outperformed in all past RBA pauses (at least the ones while they were listed). This includes CSL, SHL, RHC, MTS, EVN, TCL, APA, DMP, and NHF. The Banks (BEN, ANZ, CBA, WBC, NAB) all outperformed after all four RBA pauses. The strong historical returns for Banks were driven by strong expected EPS growth (that was largely realised). Today, EPS for Banks is forecast to decline, suggesting they are less likely to outperform after the current RBA pause. In this cycle, we prefer Insurers over Banks given Insurers are the key positive driver of Australian market earnings growth in FY24E. • Buy ideas. Outperform-rated ASX 100 stocks in sectors that tend to outperform in the year after an RBA pause are RMD, CSL, COL, EDV, NST, NEM, ORA, NXT, TLS, TLC, and TCL. Of these stocks, TLS, COL, ORA, TLC, EDV, and RMD are the most oversold, • Sell ideas. REA, NEC, JBH, SCG, VCX, SGP, RGN, and LLC are Neutral- or Underperform-rated and in sectors that tend to underperform in the year after an RBA pause. |
| Macquarie Interest rates Macquarie has increased the rates on their bank accounts Cash Management Account (transaction account) increased to 3% Accelerator Account increased to 4.75%. |
| Financial Planning Snippets – Super Guarantee (SGC) for employees increases to 11% from 1/7/23 – Commonwealth Seniors Health Care card has seen the income limit increase to $152k(couple) $95.4k (single). If you are of Age Pension age and don’t have the card, please let us know. – Account Based Pension minimum pension payments will revert back to normal from July 2023 (from half normal, which were put in place due to COVID in 2020). |
| Other Stories – Goldman Sachs doesn’t expect any further interest rate rises, while UBS says it is probably on hold, but there is a risk of a hike in Feb. – Shane Oliver believes Wednesday’s GDP of 0.4% has some upside after stronger economic data released today. – Origin Energy takeover vote failed. |
| Broker Target Price changes – Ord Minnett Morgans South 32 (S32) decreased from $5.15 (highest broker) to $4.80 (still highest broker) Morgan Stanley Nine Entertainment (NEC) decreased from $2.40 to $2.30 Macquarie Bell Potter/Citigroup UBS Tracking changes for 2023 Upgrades 318 Downgrades 340 |
| Today’s ASX sector Movements Best – IT +1.9% Worst – Utilities -2.5% |
| Core Watchlist Index (changes since last Not So) The CORE Watchlist is a collection of 30 Australian shares, predominantly “Blue Chip”. We obtain research from up to 6 brokers on each share. Each broker provides a Target Price (value in 12 months) which then provides us with an average for each stock. We then compare that average to the current price as a percentage. IE Macquarie price $176.95 Av. Target Price $205.96= 85.9% (meaning 14.1% upside over next 12 months) + income 4.35% (including franking). To get the CORE Index we take the average across the 30 stocks. This provides us with a market average as there are up to 80 teams of analysts providing the research and target prices. The CORE Watchlist stocks represent more than 55% of the ASX 200 and so provide us with a good indicator of the market value. When it’s at 100% then the market is fully priced. We have seen that when the index is below 90%, then it’s good buying, but that doesn’t happen very often. Should you have any questions, please let me know. The Core index increased from 89.93% to 90.32%. Just above the buying signal, usually below 90%. Overall Earnings Per Share (EPS) We could see an uptick in overseas company earnings (BHP MQG CSL RIO STO WDS RMD AMC BXB) as they will benefit from a lower current assumption. We have been using 70c. Moved to 68c (still conservative). FY23 increased from 3.39 to 3.44% FY24 decreased from 6.27% to 6.12% Most expensive – CBA 116.2% Least expensive – Lend Lease 54.1% The CORE Watchlist has 6 (6) stocks trading above 100%; they are; BHP CBA JBH NAB RIO WES, lowest number ever is 0, highest 9. While 8 (8) are trading below 85% (highest 18), while the lowest is 5. CSL LLC NEC ORA RMD S32 SHL STO (Figures in brackets is last Not So). STOCKS TRADING BELOW ALL BROKER FORECASTS ARE AS FOLLOWS; (it has been a handy indicator in the past). 13 out of the 30 CORE stocks are trading below the lowest broker target price. Highest 24. Lowest for some time 5. ALL current price $40.44 Broker range $43 to $46.50 AMC current price $14.29 Broker range $14.50 to $17.50 CPU current price $23.36 Broker range $24.50 to $29 CSL current price $264.17 Broker range $321 to $340 LLC current price $6.72 Broker range $7.95 to $14.45 NEC current price $1.94 Broker range $1.95 to $2.80 ORA current price $2.57 Broker range $3.00 to $4.10 ORI current price $15.65 Broker range $16.23 to $19.50 RMD current price $24.29 Broker range $26 to $40 S32 current price $3.12 Broker range $3.40 to $480 SHL current price $28.91 Broker range $31.15 to $38 STO current price $6.82 Broker range $8.10 to $12.30 TLS current price $3.79 Broker range $4.15 to $4.75 Added Removed |
| Banking Index (changes since last Not So) Like the CORE Watchlist index, the Banking index is the four major banks’ average target price based on research from up to 6 brokers. The percentage below 100% is the potential upside over the next 12 months (not including income). If at or over 100%, then this indicates the Banks are fully priced. The Banking index increased from 101.9% to 102.3%. Over 100% suggests the banks are fully priced. They have run up into the results. Based on today’s bank prices, the table below shows the estimated dividends (c) and yield. The expectation is slightly increased dividend payments and still very attractive yields. PLUS FRANKING. FY 23 % FY 24 % FY 25 % ANZ 175.0 7.16% 162.2 6.63% 163.3 6.68% CBA 450.0 4.28% 458.0 4.36% 469.8 4.47% NAB 167.7 5.85% 162.8 5.68% 162.8 5.68% WBC 142.0 6.64% 144.0 6.73% 174.2 8.14% MQG 750.0 4.44% 683.2 4.04% 726.2 4.30% Dividend expectations have been cut for BHP and RIO. Yields are still expected to be very strong. The forecasts below are for the full year. I have added FY25. BHP and RIO results will see some changing forecasts with the likelihood of further reduction. FY23 cps % FY24 cps % FY25 cps % BHP 255.00 5.41% 226.50 4.80% 261.2 5.54% RIO 617.33 4.86% 668.17 5.26% 609.4 4.80% Plus franking. Please note RIO is Calendar Year (CY). Cents per share (CPS). |
| Other Indicators (changes since last Not So) – US VIX Index decreased from 12.98 to 12.63. The VIX is near 12 month low. Showing calm. – Iron Ore increased from $128.20 to $131.15. ALL-TIME HIGH of $237.57. Av expected for 2023 is $113.9, while dropping to $102 for 2024. – Copper increased from $3.80 to $3.88. – Gold increased from $2046 to $2105. New RECORD HIGH SET TODAY $2152, previous high $2063. – AUD/USD decreased from 66.44c to 66.57c. Recent low point 62.9c. $A strengthening – Asian markets – MIXED – US 10 year Bonds decreased from 4.28% to 4.25%. recent high 5% (20/10 highest since 2006). The FED looks like it’s on HOLD. US 30 year Bond decreased from 4.45% to 4.42%. Hit a 17-year high of 5.12%. The US 2 year rate has decreased from 4.65% to 4.60% (5.37%, highest since 2006). The gap between the 2 yr and 10 years an inverse -0.35%. It was -0.37% but still inverted, which historically has suggested a recession. Widest inverse gap is -1.3%. This is the most it has been inverted in 42 years. The gap is narrowing as the long end of the yield curve increases (higher for longer). – German Bonds decreased from 2.42% to 2.36%. Hit 3% in October highest since 2008. – Japanese Bonds increased from 0.68% to 0.69%. Highest in 10 years is 0.956%. – Aussie Bonds 10 year Bonds increased from 4.40% to 4.47%. Recent high 4.95% – Other Aussie Bonds 1 year 4.36% 2 year 4.14% 4 year 4.07% 5 year 4.12% 15 year Bonds 4.69%. – Oil prices decreased from $78.08 to $73.57. – Tungsten – China remains at $305 to $315mtu. |
| This week & next week Last “Not So” opened in 7 Aust states (excl NT ), US 3 states (California, Massachusetts, Ohio), Sweden & Israel Contact details PO BOX 149 Deniliquin NSW 2710 125 End St Deniliquin NSW 2710 Ph. 03 58950100 Fax 03 58950101 Mobile 0412113524 scottm@provincialwealth.com.au kevinh@provincialwealth.com.au chrisp@provincialwealth.com.au maddyl@provincialwealth.com.au |
| The Not So DAILY BULLETIN 7 November 2023 No.595 |
| Top Stories |
| Tuesday, 7 November 2023, the ASX 200 fell 20 points after rising 19 yesterday to finish at 6977. The market has tried to break above 7000 but couldn’t hold it. The Melbourne Cup winner – Without a fight was probably a signal for the RBA rate rise (only in hindsight does it look obvious). Hopefully, it was the last rate hike and brings the RBA in line with the ECB (Europe) and the Fed (US Federal Reserve) with talk of further rate hikes but no actions. As discussed over the last few weeks, we are still at a crossroads, as mixed signals are everywhere. Bond rates are falling, Oil is down to $80, Gold is near $2000, Consumer is less confident & spending savings, China and Europe are sluggish, and Cash rates are high and elevated geopolitics issues. On the flip side, unemployment rates are historically low, company profits are okay, iron ore price remains elevated, US GDP was 4.9%, the fear index (VIX has retreated to a calm 14.89), retail sales are up, mortgage defaults are below 1%, and we are entering the best period of the year where US companies can undertake share buybacks to provide a Santa Claus rally. Bank results from NAB Nov 9 and ANZ Nov 13. WE ARE STILL CAUTIOUS in the short term but are moving back to our favour, saying BUY THE DIP. We are happy for you to share our Not So Daily Bulletin with family and friends, and if we can help them, we are also happy to chat. |
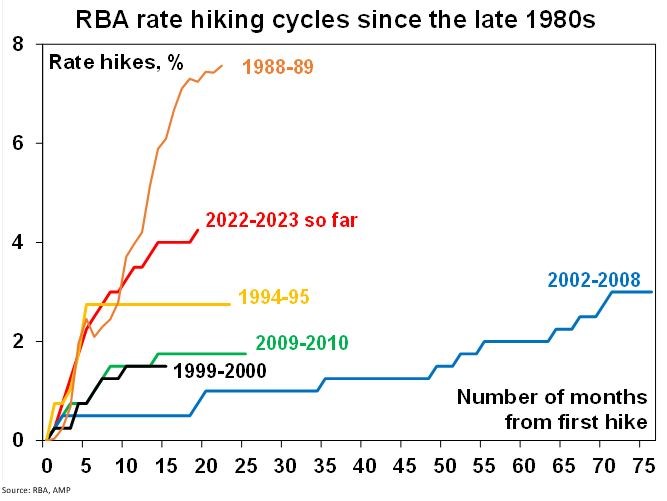
| RBA hikes, Without a fight! The RBA meeting was held today, as Kevin Hanson and most economists predicted a rate rise occurred. Below are the important points from the RBA Governor Michele Bullock’s statement. The Board decided to raise the cash rate target by 25 basis points to 4.35 per cent. Inflation in Australia has passed its peak but is still too high and is proving more persistent than expected a few months ago. The latest reading on CPI inflation indicates the prices of many services are continuing to rise briskly. While the central forecast is for CPI inflation to continue to decline, progress looks to be slower than earlier expected. CPI inflation is now expected to be around 3½ per cent by the end of 2024 and at the top of the target range of 2 to 3 per cent by the end of 2025. The Board had indicated that it would be paying close attention to developments in the global economy, trends in household spending, and the outlook for inflation and the labour market. The weight of this information suggests that the risk of inflation remaining higher for longer has increased. While the economy is experiencing a period of below-trend growth, it has been stronger than expected over the first half of the year. Conditions in the labour market have eased but they remain tight. Housing prices are continuing to rise across the country. At the same time, high inflation is weighing on people’s real incomes and household consumption growth is weak, as is dwelling investment. Given that the economy is forecast to grow below trend, employment is expected to grow slower than the labour force and the unemployment rate is expected to rise gradually to around 4¼ per cent. Returning inflation to target within a reasonable timeframe remains the Board’s priority. High inflation makes life difficult for everyone and damages the functioning of the economy. It erodes the value of savings, hurts household budgets, makes it harder for businesses to plan and invest, and worsens income inequality. And if high inflation were to become entrenched in people’s expectations, it would be much more costly to reduce later, involving even higher interest rates and a larger rise in unemployment. To date, medium-term inflation expectations have been consistent with the inflation target and it is important that this remains the case. Whether further tightening of monetary policy is required to ensure that inflation returns to target in a reasonable timeframe will depend upon the data and the evolving assessment of risks. In making its decisions, the Board will continue to pay close attention to developments in the global economy, trends in domestic demand, and the outlook for inflation and the labour market. The Board remains resolute in its determination to return inflation to target and will do what is necessary to achieve that outcome. Chart from AMP and RBA |
 |
| Financial Planning Snippets – Super Guarantee (SGC) for employees increases to 11% from 1/7/23 – Commonwealth Seniors Health Care card has seen the income limit increase to $144k(couple) $95k (single). If you are of Age Pension age and don’t have the card, please let us know. – Account Based Pension minimum pension payments will revert back to normal from July 2023 (from half normal, which were put in place due to COVID in 2020). |
| Other Stories – Goodman Group (GMG) 4th quarter confirmed 9% profit growth for FY24. $127bn of developments in pipeline. – South Korea bans short selling (good idea) market up 10% in the first 6 days of Nov. – Chinese exports fell 6.4% in USD terms but imports rose 3%. |
| Broker Target Price changes – Ord Minnett Morgans Amcor (AMC) increased from $14.25 (lowest broker) to $15.20 Macquarie Group (MQG) decreased from $194.40 to $182.80 Westpac (WBC) decreased from $21.61 to $21.58 Morgan Stanley MQG decreased from $215 (highest broker) to $202 (still highest broker) WBC increased from $20 (lowest broker) to $20.70 Macquarie AMC decreased from $14.83 to $14.80 BHP increased from $47 to $47.50 Woodside (WDS) decreased from $34 to $32 (equal lowest broker) Bell Potter/Citigroup BHP increased from $44 to $45 Goodman Group (GMG) increased from $24.50 to $25.50 (equal highest broker) MQG decreased from $175 (equal lowest broker) to $161 (lowest broker) WBC increased from $21.80 to $23.60 UBS Sonic Health (SHL) increased from $34 to $36.50 Wesfarmers (WES) decreased from $57 (equal highest broker) to $56 Tracking changes for 2023 Upgrades 307 Downgrades 309 (we have noticed the overall trend is down, but the CORE stocks are seeing upgrades. It probably reflects the quality of stocks in our 30 CORE stocks). |
| Today’s ASX sector Movements Best – IT +1.4% Worst – Financials -1% |
| Core Watchlist Index (changes since last Not So) The CORE Watchlist is a collection of 30 Australian shares, predominantly “Blue Chip”. We obtain research from up to 6 brokers on each share. Each broker provides a Target Price (value in 12 months) which then provides us with an average for each stock. We then compare that average to the current price as a percentage. IE Macquarie price $176.95 Av. Target Price $205.96= 85.9% (meaning 14.1% upside over next 12 months) + income 4.35% (including franking). To get the CORE Index we take the average across the 30 stocks. This provides us with a market average as there are up to 80 teams of analysts providing the research and target prices. The CORE Watchlist stocks represent more than 55% of the ASX 200 and so provide us with a good indicator of the market value. When it’s at 100% then the market is fully priced. We have seen that when the index is below 90%, then it’s good buying, but that doesn’t happen very often. Should you have any questions, please let me know. The Core index increased from 87.04% to 88.34%. This is usually a good BUYING signal when the CORE index is below 90%. Interestingly Bank Index is still above 100%, which suggests (not a good buying time). As mentioned before, this is the first time in 12 years these to indices have been providing opposite calls. It first happened on 21/9/23 when ASX was at 7065. We haven’t moved far. Overall Earnings Per Share (EPS) We could see an uptick in overseas company earnings (BHP MQG CSL RIO STO WDS RMD AMC BXB) as they will benefit from a lower current assumption. We have been using 70c. Moved to 68c (still conservative). FY23 decreased from 3.23% to 3.11% FY24 decreased from 8.04% to 7.98% Most expensive – CBA 109.5% Least expensive – Lend Lease 51.2% The CORE Watchlist has 6 (5) stocks trading above 100%; they are; BHP CBA JBH NAB RIO WES, lowest number ever is 0, highest 9. While 11 (12) are trading below 85% (highest 18), while the lowest is 5. CSL LLC NEC NXT ORA ORI RMD S32 SEK SHL STO (Figures in brackets is last Not So). STOCKS TRADING BELOW ALL BROKER FORECASTS ARE AS FOLLOWS; (it has been a handy indicator in the past). 13 out of the 30 CORE stocks are trading below the lowest broker target price. Highest 24. Lowest for some time 5. ALL current price $39.74 Broker range $42.80 to $46.50 AMC current price $13.98 Broker range $14.50 to $17.50 CPU current price $23.88 Broker range $24.50 to $29 CSL current price $248.12 Broker range $321 to $340 LLC current price $6.36 Broker range $7.95 to $14.45 MQG current price $159.29 Broker range $161 to $202 ORA current price $2.47 Broker range $3.00 to $4.10 ORI current price $14.90 Broker range $16.23 to $19.50 RMD current price $23.76 Broker range $26 to $40 S32 current price $3.25 Broker range $3.40 to $5.15 SHL current price $29.81 Broker range $32 to $38 STO current price $7.33 Broker range $8.10 to $12.30 TLS current price $3.87 Broker range $4.14 to $4.75 Added CPU Removed TCL |
| Banking Index (changes since last Not So) Like the CORE Watchlist index, the Banking index is the four major banks’ average target price based on research from up to 6 brokers. The percentage below 100% is the potential upside over the next 12 months (not including income). If at or over 100%, then this indicates the Banks are fully priced. The Banking index increased from 98% to 100.9%. Over 100% suggests the banks are fully priced. They have run up into the results. Westpac’s result was better than expected. Full-year $7.195bn Div 72c (up on same period last year) and a buyback of $1.5bn. Mortgage loans 90 days behind rose from 0.8% to 0.86% (still not a crisis). Macquarie’s profit was down 39% on last year which was below expectations. Dividends $2.55 was below last year, but announced a $2bn share buyback. ANZ cheapest at 94.9% Based on today’s bank prices, the table below shows the estimated dividends (c) and yield. The expectation is slightly increased dividend payments and still very attractive yields. PLUS FRANKING. FY 23 % FY 24 % FY 25 % ANZ 162.8 6.39% 163.7 6.43% 163.7 6.43% CBA 450.0 4.50% 457.7 4.58% 469.5 4.69% NAB 167.7 5.77% 168.2 5.79% 168.8 5.81% WBC 142.0 6.66% 142.7 6.69% 174.8 8.20% MQG 750.0 4.71% 683.2 4.29% 726.2 4.56% Dividend expectations have been cut for BHP and RIO. Yields are still expected to be very strong. The forecasts below are for the full year. I have added FY25. BHP and RIO results will see some changing forecasts with the likelihood of further reduction. FY23 cps % FY24 cps % FY25 cps % BHP 255.00 5.60% 226.50 4.97% 261.2 5.73% RIO 617.33 5.07% 668.17 5.49% 609.4 5.00% Plus franking. Please note RIO is Calendar Year (CY). Cents per share (CPS). |
| Other Indicators (changes since last Not So) – US VIX Index decreased from 18.14 to 14.89. The VIX is showing the market is reasonably calm. – Iron Ore increased from $119.25 to $123.75. ALL-TIME HIGH of $237.57. Av expected for 2023 is $114.1, while dropping to $99.4 for 2024. – Copper increased from $3.64 to $3.69. – Gold decreased from $1983 to $1979. Record high $2063. – AUD/USD decreased from 63.27c to 64.38c. Recent low point 62.9c. $A strengthening – USD/CNY remains at $7.30 Lowest $6.31 Highest in recent years $7.35. – Asian markets – DOWN – US 10 year Bonds decreased from 4.97% to 4.64%. recent high 5% (20/10 highest since 2006). The FED may or may not be on HOLD. US 30 year Bond decreased from 5.07% to 4.81%. Hit a 17 year high of 5.12%. US Federal Reserve on hold at 5.5% but maybe more to come in November. The US 2 year rate has increased from 5.07% to 4.92% (5.37%, highest since 2006). The gap between the 2 yr and 10 years an inverse -0.28%. It was -0.10% but still inverted, which historically has suggested a recession. Widest inverse gap is -1.3%. This is the most it has been inverted in 42 years. The gap is narrowing as the long end of the yield curve increases (higher for longer). – German Bonds decreased from 2.83% to 2.75%. Hit 3% in October highest since 2008. – Japanese Bonds decreased from 0.956% to 0.88% highest in 10 years is 0.956%. – Aussie Bonds 10 year Bonds decreased from 4.95% to 4.71%. Recent high 4.95% – Other Aussie Bonds 1 year 4.48% 2 year 4.31% 4 year 4.29% 5 year 4.35% 15 year Bonds 4.96%. Rates have decreased after the days RBA rate rise. Maybe on hold. – Oil prices decreased from $81.05 to $80.43 – Tungsten – China remains at $305 to $315mtu. |
| This week & next week Last “Not So” opened in 7 Aust states (excl NT ), US 5 states (California, Massachusetts, New York Colorado & South Carolina), Sweden, Israel & Malawi (45th country and 4th in Africa). Contact details PO BOX 149 Deniliquin NSW 2710 125 End St Deniliquin NSW 2710 Ph. 03 58950100 Fax 03 58950101 Mobile 0412113524 scottm@provincialwealth.com.au kevinh@provincialwealth.com.au chrisp@provincialwealth.com.au maddyl@provincialwealth.com.au |

Regardless of where you are in Australia, we offer you the best financial planning and advisory services. Feel free to call us today with any question you may have.

People, Big Picture Framework, Quality Services and Value for Money!
We are strong believers in integrity, honesty, professionalism and respect! Our aim is to foster healthy relationships with our clients that last a lifetime.