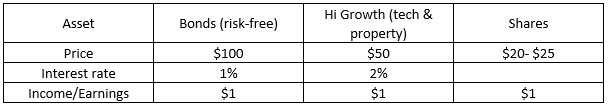
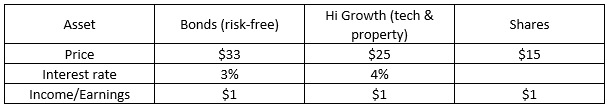
| The Not So DAILY BULLETIN 26 September 2022 No.509 Top Stories Monday, September 26, saw the ASX 200 fall 105 points or -1.6%, to finish at 6469. This is nearing the lows in June when the market fell to 6407. The low for the day was down 139 or 6435, before a slight rally in the after. However, the sectors were very mixed with Energy -6% Materials -5% Utilities -3% and Listed Property (REITS) -3%. On the other end, Health gained 2%, Consumer Staples 1.2% and IT 1.1%. The market weakness the Bell Potter Coppo report suggested would occur in September and early October. We are likely to test the June low and maybe even lower as the Central Banks fight against inflation. Last week 11 Central Banks increased rates by 6.50%, with the US rising by 0.75%. Unfortunately, not much else matters – inflation and interest rates. As I have mentioned before, markets are unlikely to settle down until the picture becomes evident in both these areas. Thankfully in Australia, we are likely to be lower in both areas compared to the US. It’s important to understand that not all companies perform the same. As an example for 2022, the ASX is down 13%, while some of the CORE stocks are positive over the year including Computershare +23% Brambles +9% Amcor +2% Woodside +37% Santos +9% NAB +2% and Westpac +0.3% We are still trapped in a global bear market. How long and how low are the questions? Hopefully, the answers are not long and far, but only time will tell. Inflation and Interest rates – the main game Many moving parts make up the world economy; however, only two major ones are driving market sentiment. INFLATION AND INTEREST RATES, and these are linked together. Unfortunately, Central Banks are playing catch up after massive stimulation (Post GFC & COVID) and cutting interest rates to record low levels. Remember negative interest rates (now only Japan has them). Inflation hasn’t been an issue for 30 years, and Central Banks believed they could control it if it started to spike. However, they didn’t anticipate the Russian invasion, COVID zero in China and global supply disruption simultaneously. The US Federal Reserve (after last week’s meeting) stated they need to control inflation by raising rates, and if that causes a recession, then that’s what they need to do. Additionally, the future path of expected rate hikes was increased to 4.4% (average) by year-end. This is 1.25% higher than what was expected only two months ago. This message is what unsettled markets in recent days. The following significant US number is October 13, when the following inflation number is produced. If it shows signs of weakening, it may allow the Federal Reserve to slow rate hikes, but otherwise, rates will continue to move higher. The chart below shows that the US Fed has increased rates faster than any other time. Markets will be dominated for the next few weeks and months by these two factors until it’s understood where the peak in interest rate occurs. In Australia, we have the new monthly CPI figure this Friday and an interest rate decision on October 4. While US Fed meets again on Nov 2 and Dec 14. Morgan Stanley increased its RBA cash rate peak from 3.1% to 3.6%  Research summary Macquarie believes we are in a BEAR MARKET, and we will continue to see bear market rallies within the bear market. But we are likely to re-test the JUNE LOWS before having another rally (those lows could be tested this week). A positive sign from Macquarie China’s iron ore imports improving: China imported 96.2Mt of iron ore in August, up by 5% MoM, driven by a recovery in domestic steel production. China’s crude steel production growth turned positive YoY recently. Ords also noted positive Iron Ore growth but suggested it would be flat for the rest of the year. Ords cut their 2023 iron ore price by 10% – 2023 $94 and 2024 $90.. UBS restated its end-of-year target of 7000. Also, staying overweight Resources and underweight Consumer Discretionary, but plenty of headwinds to negotiate. SP Angel (UK Broker) suggested the falling Yuan against USD isn’t great for commodity demand as commodities are mostly priced in USD. Price of Assets The price paid for an asset is generally determined by the income it produces. The next question is, how much do you pay for every $ of income or profit produced? A range of factors determine this, but one consistent factor is; the comparable risk-free rate of return (Government Bonds). If the risk-free interest rate is lower, other assets can increase in value. This is an important concept to understand as asset prices have benefitted from falling interest rates for the last 30 years (since the recession we had to have). However, the recent change in Bond rates means that all other assets are likely to be revalued over time (unless the asset can grow income at a higher rate than inflation). Last year Government Bonds were trading at a 1% interest rate (risk-free rate). This rate sets the benchmark for all other assets. See Table 1 below. As the table indicates, $100 invested in Bond produces $1. Therefore, high-growth investments can trade at, say, $50 for that $1 of income or earnings. This equates to a yield of 2%. In this environment, the share market can justify a value PE of 20 to 25 to generate $1 of income or earnings. However, if the Bond rate increases, this then impacts all other assets. See Table 2 below. The Bond rate increasing from 1% to 3% means the high-growth assets noted in table 1 provide a lower return than the risk-free Bonds. Therefore, the two options for hi growth assets are either a) increase the income produced to yield 4% or b) price falls from $50 to $25, so the yield is 4% and higher than the risk-free return. We have seen this with several high-flying technology companies in the US & Australia. We have recently seen forecasts of property prices falling. It’s based on this concept. In this situation, the shares also reduce from 20 to 15 PE. The Australian market has already seen PEs fall from 18 to 14. The movement in interest rates significantly impacts the value of all assets, and for the first time in many years, we are seeing rates rise and not fall. Therefore, putting pressure on asset prices. The 2nd part of this discussion relates to the income or earnings of the asset. If we have a recession, will the income of the various assets fall (rental vacancies, company profits fall)? If income falls, asset values will also fall in line with the new PEs. I think it’s important to add at this point. Our approach has always been about having quality assets (blue chip) and taking a GARP approach. Growth At a Reasonable Price. This means not chasing high-flying assets. Financial Planning Snippets – PHONE financial fraud. We are aware of a number of examples of fraud being committed by people ringing. PLEASE DO NOT GIVE YOUR BANK DETAILS OR CREDIT CARD NUMBER to a person who has RUNG YOU. – SGC is increasing to 10.5% from July 1 – The work test for those over 67 is removed from July 1. Meaning you can be retired and make further super contributions (if appropriate). – Director registration is required by November Any questions, please let us know. Other Stories (research since last Not So) – Dividends are being paid. This week includes $11.5bn from COL WOW AMC CBA FMG ORG- – UK tax cuts have sent the British pound tumbling to record lows against the USD. – Morgan Stanley sees Australian house prices falling 20% – Bloomberg noted that Chinese factories are being built in Mexico to reduce the tariffs. Broker Target Price changes Ord Minnett/JP Morgan BHP decreased from $43 to $42 Coles (COL) decreased from $17 (lowest broker) to $15.80 (still lowest) Rio Tinto (RIO) decreased from $102 to $100 Morgans COL decreased from $20.65 (highest broker) to $20 Morgan Stanley Macquarie COL decreased from $18.90 to $18.70 Seek.com (SEK) increased from $20 (lowest broker) to $20.70 (still lowest broker) Bell Potter/Citigroup Santos (STO) increased from $8.30 (lowest broker) to $9 (still lowest broker) Woodside (WDS) increased from $33.30 to $36.50 UBS COL decreased from $18.75 to $17 STO decreased from $9.45 to $9.40 Today’s ASX sector Movements Best – Health +2% Worst – Energy -6.3% Core Watchlist Index (updated from Sep 19) The CORE Watchlist is a collection of 30 Australian shares, predominantly “Blue Chip”. We obtain research from up to 6 brokers on each share. Each broker provides a Target Price (value in 12 months) which then provides us with an average for each stock. We then compare that average to the current price as a percentage. IE BHP price $38.56 Av. Target Price $39.73= 97.1% (meaning 2.9% upside over next 12 months) + income 7.11% (including franking). To get the CORE Index we take the average across the 30 stocks. This provides us with a market average as there are up to 80 teams of analysts providing the research and target prices. The CORE Watchlist stocks represent more than 55% of the ASX 200 and so provide us with a good indicator of the market value. When it’s at 100% then the market is fully priced. We have seen that when the index is below 90%, then it’s good buying, but that doesn’t happen very often. Should you have any questions, please let me know. The Core index decreased from 86.17% to 83.15%. Below 90% is generally a good buying opportunity, but rising inflation and interest rates still make us cautious. Overall Earnings Per Share (EPS) FY22 increased from 19.56% to 19.74%. FY23 decreased from 6.75% to 6.68% Most expensive – CBA 104.1% Least expensive – Nine Entertainment cheapest at 64.8%. The CORE Watchlist has 1 (1) stocks trading above 100% lowest (0) while 14 (9) are trading below 85% (highest 18). ALL GMG JBH LLC MQG NEC NXT ORA ORG ORI RIO SEK SHL STO (Figures in brackets is last Not So). Stocks trading below all broker forecasts are as follows; (it has been a handy indicator in the past). 23 out of the 30 CORE stocks are trading below the lowest broker target price. Highest 24. Lowest for some time 8. ALL current price $33.13 Broker range $40.20 to $46 AMC current price $16.81 Broker range $17.50 to $19.40 ANZ current price $23.04 Broker range $24 to $30 BXB current price $11.58 Broker range $11.80 to $14.60 CPU current price $24.79 Broker range $26 to $36 CSL current price $284.81 Broker range $321.30 to $340 GMG current price $16.78 Broker range $20.60 to $24.10 JBH current price $38.86 Broker range $41.30 to $50 LLC current price $9.01 Broker range $11.20 to $13.40 MQG current price $163.52 Broker range $172 to $231 NEC current price $1.92 Broker range $2.29 to $3.40 NXT current price $9.13 Broker range $11.75 to $14.00 ORG current price $5.20 Broker range $5.70 to $7.42 ORA current price $3.08 Broker range $3.40 to $3.95 ORI current price $13.46 Broker range $16.20 to $19.70 RIO current price $87.78 Broker range $90 to $120 SEK current price $19.63 Broker range $20.70 to $34 SHL current price $29.95 Broker range $31.50 to $38.60 STO current price $6.88 Broker range $9 to $11 TCL current price $13.03 Broker range $13.85 to $15.80 TLS current price $3.76 Broker range $4 to $4.62 WDS current price $30.20 Broker range $30.50 to $40 WBC current price $21.18 Broker range $22.25 to $29 Added BXB MQG ORG RIO TCL WDS Removed COL Banking Index Like the CORE Watchlist index, the Banking index is the four major banks’ average target price based on research from up to 6 brokers. The percentage below 100% is the potential upside over the next 12 months (not including income). If at or over 100%, then this indicates the Banks are fully priced. The Banking Index increased from 94% to 94.5%. Based on today’s bank prices, the table below shows the estimated dividends (c) and yield. The expectation is for increased dividend payments and still very attractive yields. PLUS FRANKING. FY21 % FY 22 % FY 23 % FY 24 % ANZ 142.0 6.16% 141.8 6.15% 149.8 6.50% 158.2 6.87% CBA 350.0 3.74% 379.2 4.05% 421.8 4.51% 434.4 4.64% NAB 127.0 4.33% 148.7 5.07% 165.7 5.64% 172.0 5.86% WBC 118.0 5.57% 120.4 5.68% 139.6 6.59% 155.6 7.35% MQG 470.0 2.87% 622.0 3.80% 627.4 3.84% 666.6 4.08% Updated to include 2024 for BHP and RIO. Yields are still expected to be very strong. The forecasts below are for the full year. FY22 cps % FY23 cps % FY24 cps % BHP 447.80 12.37% 336.40 9.29% 277.4 7.66% RIO 741.50 8.45% 732.00 8.34% 613.3 6.99% Plus franking. Please note RIO is Calendar Year (CY). Cents per share (CPS). Other Indicators (not changed since the last Not So) – US VIX Index increased from 26.30 to 29.92 Trading range is likely to be 17-28. Over the last 25 years, market bottoms have seen VIX reach a minimum of 48. We are still waiting for this event! – Iron Ore increased from $98.45 to $99.60 Brokers expect an average in 2023 is $113.50. ALL-TIME HIGH of $237.57. – Copper decreased from $3.52 to $3.29 It hit an ALL-TIME HIGH $5.03 at the start of the Russian invasion. – Gold increased from $1676 to $1644. Climbed above $2000 at the start of the Russian invasion. Record high $2063. – AUD/USD decreased from 66.91c to 64.95c. USD strengthening again. – USD/CNY increased from $7.01 to $7.16. Lowest $6.31 Highest in recent years $7.16 USD stronger. – USD/Euro decreased from $0.998 to $0.9632 Now well below parity. First time in 20 years. ECB may need to raise rate aggressively. UK Pound has also fallen sharply from $1.30 to $1.05 over the year. Lowest ever. – Asian markets – DOWN – US 10 year Bonds increased from 3.45% to 3.73%. Higher inflation is pushing rates up, Rates moving back up again. The recent high is 3.75% (8 year high). US 30 year Bond increased from 3.51% to 3.64% The highest level was 3.75%. US Federal Reserve meetings in Nov expecting another 0.75%. Plus BOND selling of $95bn per month (QT). The US 2 year rate has increased from 3.87% to 4.2% (4.2% highest since 2007). The gap between the 2 yr and 10 years an inverse -0.47%. It was -0.42% but still inverted, which historically has suggested a recession. Widest inverse gap is -0.51% – German Bonds increased from 1.77% to 2.03%. The highest point in eight years 1.77% as the ECB raised rates by 0.75% to 0.75%. Energy crisis causing inflation to spike in Europe. – Japanese Bonds increased from 0.247% to 0.247% 0.256% highest in some time. Yen/USD is at 27 year low. – Aussie Bonds 10 year Bonds increased from 3.70% to 4%. Recent high is 4.20% – Other Aussie Bonds 1 year 3.32% 2 year 3.66% 4 year 3.81% 5 year 3.85% 15 year Bonds 4.15%. – Oil prices decreased from $85.08 to $78.02. It reached $125 at the start of the invasion. – Tungsten – Baltimore & Rotterdam $345-$350 mtu. China $325-$335mtu. This week & next week Last “Not So” opened in 6 Aust states (excl Tas NT), US 6 states (California, Massachusetts South Carolina Delaware Connecticut & Virginia ) UK and Sweden This week -Out of office Wednesday – Thursday (daughter’s graduation), Friday (Ute Muster). Next week – HOLIDAYS, returning Oct 11 Contact details PO BOX 149 Deniliquin NSW 2710 125 End St Deniliquin NSW 2710 Ph. 03 58950100 Fax 03 58950101 Mobile 0412113524 scottm@provincialwealth.com.au kevinh@provincialwealth.com.au chrisp@provincialwealth.com.au maddyl@provincialwealth.com.au |

Regardless of where you are in Australia, we offer you the best financial planning and advisory services. Feel free to call us today with any question you may have.

People, Big Picture Framework, Quality Services and Value for Money!
We are strong believers in integrity, honesty, professionalism and respect! Our aim is to foster healthy relationships with our clients that last a lifetime.