| The Not So DAILY BULLETIN 13 March 2023 No.543 |
| Top Stories |
| Thursday, 16 March 2023, saw the ASX 200 sell off 103 points to close at 6966. The market hit a low of 6914 in the morning but recovered. The rollercoaster is back. Markets sold off today after pressure was put on Credit Suisse’s viability (Swiss Bank). As mentioned yesterday, the market will try to find weak stories in this environment as Warren Buffett said. “It’s only when the tide goes out, do you find who is swimming naked”. There have been rumours about Credit Suisse (CS) for months, so there was no surprise they were today’s target. But, I would like to point out that CS issues are unrelated to Silicon Bank. Are the traders looking for shorting targets, or are they trying to send a message to Central Banks to stop raising rates? That will be tested tonight when the European Central Bank meets. They were expected to raise interest rates by 0.5%, and many still expect a rise given their lagging US rates. The Swiss National Bank has provided CS with a liquidity facility of $A81bn. Let’s see if that settles the horses! The chart below from AMP’s Shane Oliver shows that over the last 55 years, when the US Federal Reserve (global Central Bank) raises interest rates, it usually ends in a crisis. It’s, for this reason, we have been cautious over the last year, as it’s difficult for markets to increase and sustain the increase while interest rates are rising. Hence the view that we are still in a BEAR MARKET and bear markets usually end with a crisis or a capitulation event. Is this the crisis? Maybe, but at this point, it’s more based on sentiment than economics. The real risk facing the economy is still inflation and not a lack of confidence in the bank system or a couple of banks with isolated events. Nobody knows how things unfold, but some value is appearing in quality investments. We still prefer to nibble the dips. Important data coming – Europe Central Bank (ECB) meeting tonight. – US Fed meeting Mar 21-22 |
 |
| Australia’s unemployment falls to 3.5% Australia created 64,600 jobs in February with 74,900 full-time. This was higher than the market expectation of 50,000. BetaShares economist David Bassanese says the surprise drop in the jobless level to 3.5 per cent in February ups the chances of a rate increase in April. “Today’s evidence of a strong bounce back in employment over February renews pressure on the Reserve Bank of Australia to raise interest rates at the April policy meeting. What’s more, such was the strength in the labour market report, there’s also now a risk the RBA won’t be able to signal a pause in the rate hike campaign at the next policy meeting,” Mr Bassanese said. “In terms of the interest rate outlook, the strong labour market report is one strike against the hope that the RBA will pause in April. Domestically, two other key reports before the next policy meeting are retail trade on March 28 and the monthly consumer price index report (CPI) for February on March 29. If both reports remain on the strong side, it could be a case of “three strikes and your out” for rate pause hopes.” |
| Investment Strategy (left in from yesterday) AMP’s Shane Oliver – summed up the strategy for investors rather than traders. We see shares being stronger on a one-year view as inflation falls taking pressure of central banks hopefully enabling economies to avoid a deep recession. However, right now shares are at risk of more downside until some of the issues around the US financial system, inflation, recession and short-term interest rates are resolved. There are several implications for investors: • Unlike last year, investment in government bonds should provide more protection for investors as bond yields are now higher and have potential to fall if worries of recession rise as we saw in the last week. • Non-US shares are likely to outperform US shares as they are trading on lower price to earnings multiples and have a lower exposure to the tech sector. This includes the Australian share market. • For short term investors it’s a time to be cautious. • However, while times like these can be stressful, for superannuation members and most investors the best approach is to stick to basic investment principles. These things are worth keeping in mind: 1. share market pullbacks are healthy and normal – their volatility is the price we pay for the higher returns they provide over the long term; 2. it’s very hard to time market moves so the key is to stick to an appropriate long-term investment strategy; 3. selling shares after a fall locks in a loss; 4. share pullbacks provide opportunities for investors to invest cheaply; 5. shares invariably bottom with maximum bearishness; 6. Australian shares still offer attractive income versus bank deposits; & 7. to avoid getting thrown off a long-term strategy – it’s best to turn down the noise around all the negative news flow |
| Electricity Pricing Lots of media scare stories again about electricity prices going through the roof. I have looked into this in more detail and found that while prices will likely rise over the next couple of months, they will fall sharply. The main factors that drive electricity prices are the price of energy – natural gas, coal and, to a lesser extent, oil. Natural Gas has fallen on global markets from the start of the year from $7 to $2.50 (hit a high of $9.70 in Oct) as pressure has reduced after Europe’s winter was milder, and they were able to source enough non-Russian gas. Thermal coal prices have reduced by 50% since the end of the year; again, the mild European winter helped, and oil prices are at their lowest point since Dec 2021. According to AMP’s Shane Oliver, retail electricity prices lag wholesale prices by a few quarters, as shown in the graph below. This suggests retail prices have yet to peak, but wholesale prices have been falling sharply due to the dramatic fall in energy, which should see prices fall rapidly toward the 2nd half of the year. This suggests that any future fall isn’t due to the Government’s pricing cap. |
 |
| Exchange Traded Funds (ETF) – series Our preference is to use ETFs with a smart beta system (where available). A smart beta ETF has rules (criteria) regarding the selection of investments. The seventh ETF profiled is an existing option that is focused on the Asian markets. 7. iShares Europe Asia (IAA) gives investors exposure to the 50 leading companies listed in China, Hong Kong, Macau, Singapore, South Korea and Taiwan At 28th February 2023 the fund holds 64 stocks, the Price to Earnings (PE) is 11.4 times, and the Dividend Yield is 2.58%. Return on Equity 17.1%. Current top 10 holdings |
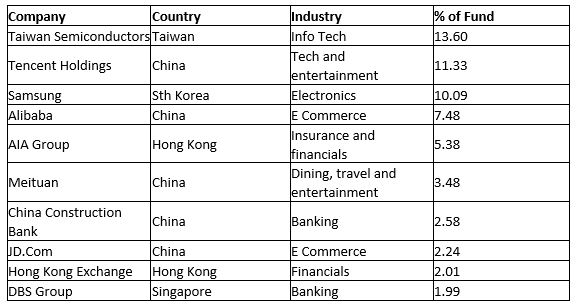
By Industry % By Region
Info Tech 33.8 China 40.3
Banking/Financials 23.6 Taiwan 22.2
Consumer Discretionary 17.2 South Korea 21.2
Communication 17.0 Hong Kong 10.9
Singapore 5.1
Summary
The Asian economies are still the quickest growing in the world with the largest populations. They are likely to provide some of the largest companies in the future years to come. This fund gives exposure to those growing companies by investing in the top 50 Asian companies. Currently trading at very attractive levels with PE 11 and a Dividend Yield of 2.58%.
Previously reviewed
1. Global Value (VLUE)
2. International Quality (QUAL) & hedged currency (QHAL)
3. International Small Company Quality ETF (QSML)
4. Global Health (IXJ)
5. China New Economy (CNEW)
6. Europe (IEU)
| Financial Planning Snippets – PHONE financial fraud. We are aware of a number of examples of fraud being committed by people ringing. PLEASE DO NOT GIVE YOUR BANK DETAILS OR CREDIT CARD NUMBER to a person who has RUNG YOU. – The work test for those over 67 is removed from July 1. Meaning you can be retired and make further super contributions (if appropriate). – Commonwealth Seniors Health Care card has seen the income limit increase to $144k(couple) $90k (single). If you are of Age Pension age and don’t have the card, please let us know. |
| Other Stories (research since last Not So) – Credit Suisse is borrowing $A81bn from the Swiss National Bank for liquidity purposes. |
| Broker Target Price changes – Ord Minnett Morgans Morgan Stanley Macquarie Bell Potter/Citigroup UBS Tracking changes for 2023 Upgrades 84 Downgrades 76 (we have noticed the overall trend is down but the CORE stocks are seeing upgrades. It probably reflects the quality stocks in our 30 CORE stocks). |
| Today’s ASX sector Movements Best – Healthcare +1.5% Worst – Energy -4.8% Materials -3.2% Financials -1.4% |
| Core Watchlist Index (changes since last Not So) The CORE Watchlist is a collection of 30 Australian shares, predominantly “Blue Chip”. We obtain research from up to 6 brokers on each share. Each broker provides a Target Price (value in 12 months) which then provides us with an average for each stock. We then compare that average to the current price as a percentage. IE BHP price $38.56 Av. Target Price $39.73= 97.1% (meaning 2.9% upside over next 12 months) + income 7.11% (including franking). To get the CORE Index we take the average across the 30 stocks. This provides us with a market average as there are up to 80 teams of analysts providing the research and target prices. The CORE Watchlist stocks represent more than 55% of the ASX 200 and so provide us with a good indicator of the market value. When it’s at 100% then the market is fully priced. We have seen that when the index is below 90%, then it’s good buying, but that doesn’t happen very often. Should you have any questions, please let me know. The Core index decreased from 90.48% to 89.54%. Usually below 90% is a good buy signal. Overall Earnings Per Share (EPS) FY23 decreased from 3.96% to 3.87% FY24 increased from 11.36% to 11.41% Most expensive – CBA 104.7% takes the title back from Rio Tinto who dropped 4% today. Least expensive – Lend Lease 69.4%. An interesting article by Chanticleer in the Financial review suggesting the market is mispricing this stock. The CORE Watchlist has 5 (5) stocks trading above 100%, they are BHP CBA ORG RIO WOW, lowest number ever is 0, highest 9. While 10 (8) are trading below 85% (highest 18). ALL ANZ CPU CSL GMG LLC NEC NXT STO WBC (Figures in brackets is last Not So). Stocks trading below all broker forecasts are as follows; (it has been a handy indicator in the past). 9 out of the 30 CORE stocks are trading below the lowest broker target price. Highest 24. Lowest for some time 8. ALL current price $34.30 Broker range $40.50 to $43 ANZ current price $22.72 Broker range $25.91 to $31 CPU current price $20.81 Broker range $24 to $29.78 CSL current price $289.28 Broker range $315 to $350 LLC current price $7.25 Broker range $8.32 to $14.45 NAB current price $27.82 Broker range $30 to $33 NXT current price $10.17 Broker range $11 to $12.90 ORA current price $3.24 Broker range $3.50 to $3.80 STO current price $6.82 Broker range $8.30 to $12 TLS current price $4.10 Broker range $4.20 to $4.75 WBC current price $21.19 Broker range $23.50 to 30 Added Removed |
| Banking Index Like the CORE Watchlist index, the Banking index is the four major banks’ average target price based on research from up to 6 brokers. The percentage below 100% is the potential upside over the next 12 months (not including income). If at or over 100%, then this indicates the Banks are fully priced. The Banking index decreased from 90.2% to 88.8%. Uncertainty regarding global banks. Under 90% is usually a good buy signal. Based on today’s bank prices, the table below shows the estimated dividends (c) and yield. The expectation is for increased dividend payments and still very attractive yields. PLUS FRANKING. FY 22 % FY 23 % FY 24 % ANZ 146.0 6.43% 157.8 6.95% 163.2 7.18% CBA 385.0 4.04% 442.2 4.64% 453.3 4.76% NAB 150.2 5.40% 173.3 6.23% 178.2 6.40% WBC 125.0 5.90% 144.8 6.83% 150.0 7.08% MQG 622.0 3.55% 675.6 3.86% 674.0 3.85% Dividend expectations have been cut for BHP and RIO. Yields are still expected to be very strong. The forecasts below are for the full year. FY22 cps % FY23 cps % FY24 cps % BHP 451.00 10.39% 296.20 6.83% 304.4 7.02% RIO 717.67 6.26% 680.33 5.93% 665.2 5.80% Plus franking. Please note RIO is Calendar Year (CY). Cents per share (CPS). |
| Other Indicators (changes since last Not So) – US VIX Index increased from 23.73 to 26.14 Trading range is likely to be 17-28. Over the last 25 years, market bottoms have seen VIX reach a minimum of 48. We are still waiting for this event! It reached 30.1 when Silicon Valley collapsed. – Iron Ore decreased from $132 to $130.2 Was below $80 in November, but the reopening of CHINA has seen a strong rally. ALL-TIME HIGH of $237.57. Av expected for 2023 is $104.20 – Copper decreased from $4.00 to $3.85 China re-opening and shortage expected in 2023. It hit an ALL-TIME HIGH $5.03 at the start of the Russian invasion. – Gold increased from $1905 to $1921. Climbed above $2000 at the start of the Russian invasion. Record high $2063. – AUD/USD decreased from 66.82c to 66.36c. – USD/CNY increased from $6.86 to $6.90. Lowest $6.31 Highest in recent years $7.35 – Asian markets – MIXED (surprisingly) – US 10 year Bonds decreased from 3.67% to 3.50%. Rates are bouncing around after the depositor bailout of Silicon Valley bank. 4.23% (8 year high). US 30 year Bond decreased from 3.78% to 3.67% The highest level was 4.27%. US Federal Reserve peak maybe lower than 5.4% to 5.50%, currently 4.75% Next weeks meeting will be VERY IMPORTANT. The US 2 year rate has decreased from 4.32% to 3.97% (5.08%, highest since 2006). The gap between the 2 yr and 10 years an inverse -0.47%. It was -0.65% but still inverted, which historically has suggested a recession. Widest inverse gap is -1.1%. This is the most it has been inverted in 42 years. It has narrowed from 0.93% to 0.47% in 3 days. – German Bonds decreased from 2.45% to 2.25%. 2.74% highest since 2008 – Japanese Bonds decreased from 0.327% to 0.289% 0.508% highest in many years. Widening the range to 0.5% Japan had the highest inflation read for 40 years. The Bank of Japan chair is changing. Will this change their low-interest rate policy? – Aussie Bonds 10 year Bonds decreased from 3.44% to 3.36%. Recent high is 4.21% – Other Aussie Bonds 1 year 3.11% 2 year 3% 4 year 2.93% 5 year 3% 15 year Bonds 3.67%. The yields down again – Oil prices decreased from $72.09 to $68. Lowest point since Dec 2021 – Tungsten – Baltimore & Rotterdam remained at $340 – $345 mtu. China $325 to $340mtu. |
| This week & next week Last “Not So” opened in 5 Aust states (excl NT Tas ACT), US 4 states (California, Massachusetts Colorado and South Carolina) Sweden This week – March reviews Next week – March reviews Contact details PO BOX 149 Deniliquin NSW 2710 125 End St Deniliquin NSW 2710 Ph. 03 58950100 Fax 03 58950101 Mobile 0412113524 scottm@provincialwealth.com.au kevinh@provincialwealth.com.au chrisp@provincialwealth.com.au maddyl@provincialwealth.com.au |

Regardless of where you are in Australia, we offer you the best financial planning and advisory services. Feel free to call us today with any question you may have.

People, Big Picture Framework, Quality Services and Value for Money!
We are strong believers in integrity, honesty, professionalism and respect! Our aim is to foster healthy relationships with our clients that last a lifetime.