| The Not So DAILY BULLETIN 8 May 2023 No.556 |
| Top Stories |
| Monday, 8 May 2023, saw the ASX 200 gain 57 points to finish at 7277. We are in a trading range again between 7000 and 7400. Today, Westpac results were better than expected, up 22% and a nice dividend increase. Like the other banks, there is uncertainty in the outlook. So the results from the banks can be summed up by saying better than fear, worse than hoped! Last week, the US and European Central Banks increased interest rates as inflation remains high and the jobs market is yet to be impacted by rising rates. On Friday, another 235,000 jobs were created in the US last month, which was more than expected. US unemployment fell to a recent record of 3.4% (difficult to have a recession with this level of unemployment). This led to a jump in the US markets on Friday, providing a strong lead for our market today. US regional Banks are under pressure from hedge funds short selling (selling shares you don’t own). This creates uncertainty, and we risk other banking collapses (deposits are ok). At best, this will force banks to undertake stricter lending (likely); at worst, it could cause another credit crunch (unlikely), but we are likely to see more volatility in the coming weeks. Important announcements this week. Budget – tomorrow night, maybe expecting a surplus. Wednesday night- US inflation data. Thursday – Bank of England – rate decision. We are expecting another rate rise. We are still cautious at this point. |
| Australian Equity Market Macquarie held a conference last week with 100 companies presenting. Some observations made were provided by Macquarie research today. • Australian consumer is slowing. Despite the lowest unemployment in decades and high immigration, there are ongoing signs the consumer is slowing, especially in the areas that benefited most from COVID and where demand is impacted more by interest rates. Multiple companies talked to consumers trading down as household budgets come under pressure. As more fixed-rate mortgages roll-off, and past rate hikes bite the pressures on consumer spending will likely increase. Travel remains a bright spot as pent-up demand supports sales. • Inflation is easing. Last year labour cost pressures were a theme of the conference, but this appears to be normalising. Industrial and Mining companies in particular appear to be seeing improving labour availability. Health Services appear to be one area where labour cost pressures are still more acute, but from a contrarian view, Health Services are one of the last areas impacted by COVID that can still see an earnings recovery. • Was this the downgrade conference some feared? Probably not. There were downgrades, and all four media stocks posted disappointing earnings updates. On the positive side, there were a few upgrades • RBA + Australian housing. Residential REITs called out the improvement in operating trends they were seeing when the RBA did not hike in April. It remains to be seen how much the surprise RBA hike impacts the nascent housing recovery in the short term. Longer term, there was a bullish view on residential property given Australia’s strong immigration and the housing shortage. Actions from Macquarie • Remain defensive. We believe the results of the 25th Australian conference are consistent with our cautious view on the cycle. We continue to think the US is headed for a recession later this year and that this will drive more volatility. Australia may avoid recession thanks to high immigration, but a US recession is still likely to impact Australian equities. |
| Bank Profits Over the last week, 4 of the five major banks (excl CBA) have provided profit results. All saw increases and importantly for investors, increases in dividends. However, the outlook statements suggested a tightening of the economy due to inflation and interest rates. In the table below, I have provided some information regarding their results. Macquarie has produced a profit for the 54th consecutive year. |
 |
| Federal Budget Treasurer Chalmers will deliver his first budget tomorrow night. Expectations are for new taxes, including petroleum tax and cost of living hand-outs for electricity and delayed or dumped infrastructure. While lots of talk over the last year about how bad the budget is, and we were likely to see a $1tr debt. There has been a significant turnaround to the point where FY23 could provide a surplus. The October budget update suggested the budget deficit for FY23 would be -$36.9bn and FY24 -$44bn. There are suggestions the actual result for FY23 could be a small surplus. Either way a vast improvement from a year ago. The likely reasons for the improvements. – rising wages (more income tax & GST) – lower unemployment (fewer benefits paid) – higher commodity prices (more tax) The chart below from UBS shows the price of iron ore, coal and gas compared to the expectation in the budget. I will provide a more detailed update on the budget issues in the next Not So Daily. |
 |
| Investment Committee meeting (left in from last Not So) Yesterday we conducted our investment committee meeting with Brad Matthew, Kevin and myself. We noted the number of crosswinds that were buffering markets a) inflation remaining higher for longer, b) interest rates hadn’t peaked yet c) continuing issues with regional US banks, which is likely to tighten lending standards. d) China’s re-opening slower than expected e) US debt ceiling is still to be resolved. f) Jobs growth delaying recession or avoiding recession? g) Consumer spending holding up. h) Company profits are better than expected. i) Expectations of higher minimum wages and increasing immigration These issues make it difficult to predict market direction and asset values. Many institutions believe we are still in a BEAR market. In recent Not So’s, we’ve discussed the likelihood of a HARD LANDING (major recession), SOFT LANDING (mild recession or slowdown) or NO RECESSION. In yesterday’s meeting, Brad presented the matrix below, which helped us understand these events’ chances. To explain, the three scenarios of NO, SOFT and HARD landing are across the top. Down the left side, two variations of inflation. The first is if inflation meets current expectations, which is seen as falling and will retreat to normal levels of 2% within a year or so. In that scenario, company earnings (profits) remain reasonable; markets will likely rally strongly. Unfortunately, this is only given a 5% chance. Brad suggested the market consensus is for a SOFT LANDING and inflation within current expectations. This would justify the recent rally and may see a further rally—a probability of 20%. However, there is growing evidence that inflation may remain HIGHER FOR LONGER, given that services inflation is falling slowly. This is the second variation. Each probability is provided with the highest chance of going to a HIGHER FOR LONGER INFLATION and a SOFT LANDING. Higher interest rates and the share market may give up some of the recent rallies. Unfortunately, there is NOT ONE clear direction or landing point. That’s why we are still cautious but happy to buy and dip. |
 |
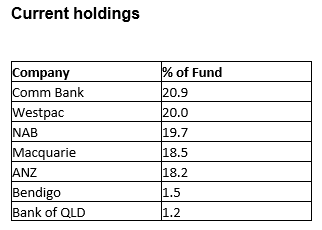
| Exchange Traded Funds (ETF) – series We prefer using ETFs with an intelligent beta system (where available). A smart beta ETF has rules (criteria) regarding the selection of investments. The 11th ETF profiled is an existing option focused on Australian Banks. 11. VanEck Australian Banks (MVB) gives investors exposure to Australian Banks At 25th April 2023 the fund holds 7 stocks, the Price to Earnings (PE) is 13.2 times, and the Dividend Yield is 4.98%. Return on Equity 12.09%. |
Summary
Australian Banks have been the cornerstone of many portfolios with health tax-effective income. Instead of owning each bank, this option provides access to the five major banks, which account for over 97% of this ETF. It also pays 3 dividends per year.
Previously reviewed
1. Global Value (VLUE)
2. International Quality (QUAL) & hedged currency (QHAL)
3. International Small Company Quality ETF (QSML)
4. Global Health (IXJ)
5. China New Economy (CNEW)
6. Europe (IEU)
7. Asia (IAA)
8. Global Infrastructure (IFRA)
9. Australia Property (MVA)
10. Cybersecurity (HACK)
| Financial Planning Snippets The work test for those over 67 is removed from July 1. Meaning you can be retired and make further super contributions (if appropriate). Commonwealth Seniors Health Care card has seen the income limit increase to $144k(couple) $90k (single). If you are of Age Pension age and don’t have the card, please let us know. |
| Other Stories – US may reach the debt ceiling by early June. No resolution yet. – US unemployment 3.4% |
| Broker Target Price changes – Ord Minnett Morgans Amcor (AMC) decreased from $16.20 to $15.20 ANZ decreased from $26.24 to $25.74 JB Hi Fi (JBH) increased from $48 to $50 Macquarie Group (MQG) decreased from $214.50 to $201.80 National Aust Bank (NAB) decreased from $28.78 to $28.02 Morgan Stanley AMC decreased from $15.50 to $14 (lowest broker) ANZ decreased from $26.24 to $25.74 BHP increased from $41.35 to $41.75 MQG decreased from $231 (highest broker) to $215 (still highest broker) NAB decreased from $30 (equal highest broker) to $27.70 Macquarie AMC decreased from $17.38 to $15.70 ANZ decreased from $26 to $24 (lowest broker) Computershare (CPU) decreased from $26 to $25 NAB decreased from $30 to $28 Bell Potter/Citigroup ANZ decreased from 27.25 to $26.50 BHP increased from $43 to $45.50 MQG decreased from $190 to $175 NAB decreased from $29.50 to $27.50 UBS AMC decreased from $18 (highest broker) to $16.30 (still highest broker) ANZ increased from $25 (lowest broker) to $26 JBH increased from $46 to $47.50 MQG decreased from $211 to $200 Tracking changes for 2023 Upgrades 135 Downgrades 131 (we have noticed the overall trend is down but the CORE stocks are seeing upgrades. It probably reflects the quality stocks in our 30 CORE stocks). |
| Today’s ASX sector Movements Best – Energy +2.5% Worst – Consumer Staples -0.9% |
| Core Watchlist Index (changes since last Not So) The CORE Watchlist is a collection of 30 Australian shares, predominantly “Blue Chip”. We obtain research from up to 6 brokers on each share. Each broker provides a Target Price (value in 12 months) which then provides us with an average for each stock. We then compare that average to the current price as a percentage. IE Macquarie price $176.95 Av. Target Price $205.96= 85.9% (meaning 14.1% upside over next 12 months) + income 4.35% (including franking). To get the CORE Index we take the average across the 30 stocks. This provides us with a market average as there are up to 80 teams of analysts providing the research and target prices. The CORE Watchlist stocks represent more than 55% of the ASX 200 and so provide us with a good indicator of the market value. When it’s at 100% then the market is fully priced. We have seen that when the index is below 90%, then it’s good buying, but that doesn’t happen very often. Should you have any questions, please let me know. The Core index increased from 92.36% to 93.64%. Overall Earnings Per Share (EPS) FY23 decreased from 5.15% to 5.08% FY24 decreased from 8.9% to 8.45% Most expensive – CBA 107.9% WOW 107.6% Least expensive – Lend Lease 74.5%. The CORE Watchlist has 7 (6) stocks trading above 100%, they are BHP CBA COL JBH SHL WES WOW, lowest number ever is 0, highest 9. While 4 (6) are trading below 85% (highest 18) lowest for a while is 3. LLC NEC SEK STO (Figures in brackets is last Not So). Stocks trading below all broker forecasts are as follows; (it has been a handy indicator in the past). 8 out of the 30 CORE stocks are trading below the lowest broker target price. Highest 24. Lowest for some time 5. ALL current price $37.78 Broker range $41.20 to $43 ANZ current price $23.83 Broker range $24.00 to $31 CPU current price $21.99 Broker range $22.60 to $28 CSL current price $301.27 Broker range $315 to $350 LLC current price $7.79 Broker range $8.32 to $14.45 ORA current price $3.34 Broker range $3.50 to $3.80 STO current price $7.30 Broker range $7.75 to $12 WBC current price $21.74 Broker range $22.50 to $29 Added Removed AMC |
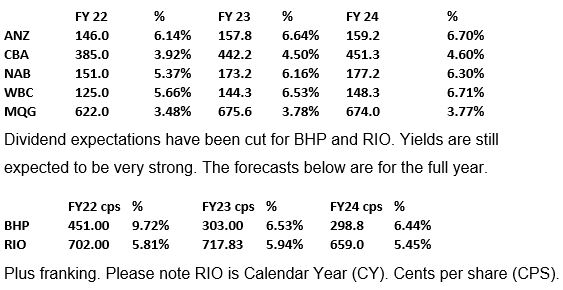
| Banking Index Like the CORE Watchlist index, the Banking index is the four major banks’ average target price based on research from up to 6 brokers. The percentage below 100% is the potential upside over the next 12 months (not including income). If at or over 100%, then this indicates the Banks are fully priced. The Banking index decreased from 98.6% to 95.6% The Bank reporting season was OK(ish) but outlook statements were mute. Based on the target price changes ANZ 90% CBA 107.9% NAB 97.8% & WBC 97.8%. Based on today’s bank prices, the table below shows the estimated dividends (c) and yield. The expectation is for increased dividend payments and still very attractive yields. PLUS FRANKING. FY 22 % FY 23 % FY 24 % ANZ 146.0 6.13% 162.5 6.82% 163.0 6.84% CBA 385.0 3.96% 440.0 4.53% 451.3 4.65% NAB 151.0 5.57% 169.2 6.24% 169.3 6.25% WBC 125.0 5.75% 143.8 6.62% 148.3 6.82% MQG 622.0 3.59% 738.0 4.25% 696.6 4.01% Dividend expectations have been cut for BHP and RIO. Yields are still expected to be very strong. The forecasts below are for the full year. FY22 cps % FY23 cps % FY24 cps % BHP 451.00 10.08% 295.40 6.61% 290.0 6.48% RIO 702.00 6.27% 718.67 6.42% 700.7 6.26% Plus franking. Please note RIO is Calendar Year (CY). Cents per share (CPS). |
| Other Indicators (changes since last Not So) – US VIX Index decreased from 17.78 to 17.74 Bounced off the lowest level Oct 2021. Trading range is likely to be 17-28. – Iron Ore decreased from $102.05 to $98.70 ALL-TIME HIGH of $237.57. Av expected for 2023 is $104.20 – Copper increased from $3.85 to $3.93 China re-opening and shortage expected in 2023. It hit an ALL-TIME HIGH $5.03 at the start of the Russian invasion. – Gold increased from $2026 to $2030. near 1 year high. Record high $2063. – AUD/USD increased from 66.65c to 67.87c. – USD/CNY increased from $6.91 to $6.92 Lowest $6.31 Highest in recent years $7.35 – Asian markets – UP except Japan. – US 10 year Bonds increased from 3.43% to 3.44%. Rates have reduced on an expectation of a slowing economy & potential rate cuts. 4.23% (8 year high). US 30 year Bond increased from 3.71% to 3.74% The highest level was 4.27%. US Federal Reserve peak maybe lower than 5.4% to 5.50%, currently 5%. The US 2 year rate has decreased from 3.97% to 3.94% (5.08%, highest since 2006). The gap between the 2 yr and 10 years an inverse -0.5%. It was -0.64% but still inverted, which historically has suggested a recession. Widest inverse gap is -1.1%. This is the most it has been inverted in 42 years. – German Bonds increased from 2.26% to 2.30%. 2.74% highest since 2008 – Japanese Bonds decreased from 0.42% to 0.41% 0.508% highest in many years. Widening the range to 0.5% Japan had the highest inflation read for 40 years. The Bank of Japan chair is changing. Will this change their low-interest rate policy? – Aussie Bonds 10 year Bonds decreased from 3.42% to 3.41%. Recent high is 4.21% – Other Aussie Bonds 1 year 3.62% 2 year 3.19% 4 year 3.11% 5 year 3.14% 15 year Bonds 3.67%. The yields moved higher, but are still below the cash rate. – Oil prices increased from $71.74 to $72.12. Fell below $70 over the weekend. – Tungsten – Baltimore & Rotterdam remained at $340 – $345 mtu. China $325 to $340mtu. |
| This week & next week Last “Not So” opened in 5 Aust states (excl NT Tas ACT), US 4 states (California, Massachusetts Colorado & New York) Sweden, Israel and UK Contact details PO BOX 149 Deniliquin NSW 2710 125 End St Deniliquin NSW 2710 Ph. 03 58950100 Fax 03 58950101 Mobile 0412113524 scottm@provincialwealth.com.au kevinh@provincialwealth.com.au chrisp@provincialwealth.com.au maddyl@provincialwealth.com.au |

| The Not So DAILY BULLETIN 13 April 2023 No.551 |
| Top Stories |
| Thursday, 13 April 2023, saw the ASX 200 fall 20 points to close at 7324. The market has continued to rally after the RBA paused rates earlier this month (up 2%). But will rate stay at this level. A critical marker for the RBA is the unemployment rate and job creation. Today, the March figures showed 53,000 new jobs created, leaving the unemployment rate at 3.5%. This may see the RBA increase rate again in May (coupled with other factors such as rising property prices). Overnight, the US headline inflation result showed a drop in inflation from 6% to 5%, BUT the Core inflation rose from 5.5% to 5.6%. This suggests that inflation is coming down, but it will be a slow process that could take some time. If this is the case, interest rates (while close to peaking) may be held higher for longer and rate cuts may be pushed into mid-24. Over the last year, we have been concerned that a rising inflation and interest rate environment could cause markets to have a major sell-off. The chart below shows that we end with a crisis when the US Federal Reserve has increased interest rates every time since 1968. Let’s hope this crisis was the short-lived collapse of the Silicon Valley Bank. |
 |
| Kevin and I have been discussing the different market scenarios and have concluded we are looking at three main scenarios. 1. HARD LANDING This is where there is a global recession, increasing unemployment and inflation remaining high. Likely to see more corporate failures and problems in the banking and property markets as profits fall sharply. This usually sees a major market collapse (capitulation). 2. SOFT LANDING This is where there is an economic slowdown from rising rates and a slight increase in the unemployment rate, but due to strong job demand, it has little impact on the economy. The economy may or may not have a recession, but it’s mild, and profits dip briefly. 3. NO LANDING This is not usually an option in a rising interest rate environment; however, this time, it is an option as the demand for employees is still robust. In a slowing economy, workers’ demand is usually falling. Currently, in the US, there are 1.8 jobs available for every worker, and in Australia, it’s 0.95 jobs available. I’m wary of saying it’s “different time”, but the graph below suggests the jobs market remains strong. And while it remains strong, people have jobs and incomes and will continue to spend as the consumer is 70% of the economy. |
 |
| Our best guess is a soft or no landing scenario, but at this point, we can’t rule out the hard landing. To date, the risk of a hard landing has kept us cautious. The US quarterly profit season starts this week with the major banks, and the expectation is lower profits from tightening credit after last month’s banking crisis (hopefully short-lived). This should provide greater insight into which scenario is possible. IF the hard landing option can be removed, there is growing evidence that the worst of the market may be behind us. The chart below from the Coppo report shows the share market usually bottoms 6 to 9 months before the profits (earnings) bottom. This means that companies report falling profits and the market is increasing. This happens because the share market is forward-looking and is looking towards the future. Currently, the market is seeing inflation moving lower, and the Central Banks are generally either on hold or one to two rate rises from peaking. This increases the view that the Central Banks will drive the economy into a deep recession, and a mild recession could be the worst result. |
 |
| The chart below is also from Coppo report and shows the current market expectation of US profits. We are about to have the 1st Quarter profits (1Q) which show an expected 7% drop. This may be followed up with a 6% drop in 2nd Quarter (2Q), but we will know these numbers in July/August. If the 3rd quarter is a gain (July to September), then the low in profits would be April to June 2023, and the low in the stocks market would be September 2022 (markets have rallied since then) or 6 to 9 months earlier which corresponds with the graph above. |
 |
| While there is still a reasonable amount of uncertainty about the economic & market outlook, which sees institutional bearishness at near 20-year highs, there continues to be record levels of cash on the sidelines, waiting for an investment opportunity, as shown by the graph below (also from Coppo report). This probably explains why any market dips have been short and shallow, as investors have been quick to buy any dips. This is our mantra, given there is still a reasonable amount of uncertainty in the global economic slowdown that Central Banks are trying to achieve while they reduce inflation back to a target of 2%. |
 |
| Bank Profits peaking As a sign of profits falling both Citigroup and Macquarie updated their views on the Australian banks today. Below are extracts from their research. Citigroup research A peak cash rate (Citi forecasting 3.6%) means that peak bank net interest margin (NIM) or bank profitability has likely arrived. A substantial pause at 3.6% by the RBA will mean that a dramatic fall-away is unlikely. The peak cash rate signals an end to the material benefit from low-rate deposits as depositors are wanting higher interest rates on their accounts. Profit/Earnings revisions — On average across our coverage, we have adjusted our FY23/25E earnings downwards by 5-10%, reflecting a lower peak cash rate and lower long-term bond rates. Stock views — We maintain our positive view on the sector as it appears stronger in a relative sense, to other ASX sectors suffer both financial and operating deleverage. ANZ and WBC remain our key Buy calls. Macquarie research Banks are set to deliver record results in 1H23, underpinned by ~10-20bps of margin expansion. We expect the market to focus on the outlook for margins, expenses, and credit quality. While banks have successfully managed to optimise deposit margins until earlier this year, competition has recently stepped up, and coupled with mortgage pricing headwinds, we expect banks to guide to lower margins in 2H23 (we are ~5-10% below consensus in FY24). We see potential upside risk to share prices in the upcoming reporting season (May for ANZ NAB and WBC). However, on a medium-term view, we continue to see risks from margin headwinds and potential credit quality concerns, which forms the basis for our Underweight sector view. Our order of preference is ANZ, NAB, WBC, CBA. |
| Origin Energy takeover Update on takeover Origin Energy (ORG) has signed a Scheme of Implementation to progress the Brookfield takeover offer, which values the business at about $8.90. Directors intend to recommend the offer subject to a favourable report from the independent expert or no superior offer. Any dividends paid by Origin before implementation will reduce the consideration payable, including the 16.5 cents fully franked paid on 24/03/2023. The Scheme is subject to conditions including regulatory approval. Origin has undertaken to assist in the preparatory steps to break into two businesses, Integrated Gas and Energy markets. They are targeting implementation in early 2024. At this stage, shareholders do not need to take any action. |
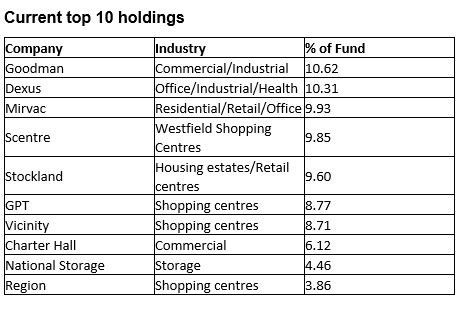
| Exchange Traded Funds (ETF) – series We prefer using ETFs with an intelligent beta system (where available). A smart beta ETF has rules (criteria) regarding the selection of investments. The ninth ETF profiled is an existing option focused on Australian Listed Property or REITs. 9. Van Eck Australian Property ETF (MVA) gives investors exposure to a selection of Australian Real Estate Investment Trusts (A-REITS) On 28th February 2023, the Fund held 17 stocks, the Price to Earnings (PE) was 12.73 times, and the Dividend Yield was 4.99%. Return on Equity 15.28%. |
Summary
Australian Property trusts are facing higher interest rates and vacancies from COVID (work from home), especially for offices and workspaces. On the flip side, continued demand for warehousing and other forms of property sees solid rental growth and the opportunity for capital growth. This area needs to determine whether the interest rate storm will benefit from falling rates next year.
Previously reviewed
1. Global Value (VLUE)
2. International Quality (QUAL) & hedged currency (QHAL)
3. International Small Company Quality ETF (QSML)
4. Global Health (IXJ)
5. China New Economy (CNEW)
6. Europe (IEU)
7. Asia (IAA)
8. Global Infrastructure (IFRA)
| Macquarie Virtual Adviser Network (VAN) We have decided to join Macquarie’s VAN program, which runs for 18 months. It’s a program designed to improve financial planning businesses. As part of the improvement process, we are surveying clients via a questionnaire. The questionnaire is being sent out by KPMG this week. Should you receive an email from KPMG, it’s not a scam. Please complete the survey if you can. We appreciate any help you can provide. |
| Financial Planning Snippets – The work test for those over 67 is removed from July 1. Meaning you can be retired and make further super contributions (if appropriate). – Commonwealth Seniors Health Care card has seen the income limit increase to $144k(couple) $90k (single). If you are of Age Pension age and don’t have the card, please let us know. |
| Other Stories – RBA has revealed 16% of mortgages are unable to move their mortgages as they do not meet the tougher serviceability assessment rules. – Wesfarmers sold final $688m of Coles. |
| Broker Target Price changes – Ord Minnett Computershare (CPU) increased from $24 to $25 Morgans NextDC (NXT) increased from $13 (highest broker) to $13.50 Morgan Stanley Macquarie CBA decreased from $94 to $90 NAB decreased from $31 to $30 Westpac (WBC) decreased from $23.50 to $23 Bell Potter/Citigroup ANZ decreased from $29.25 to $27.25 CBA decreased from $83 (lowest broker)to $80 (still lowest broker) NAB decreased from $32.75 (highest broker) to $29.50 NXT increased from $12.60 to $14.45 Westpac (WBC) decreased from $30 (highest broker) to $26.25 UBS NXT increased from $12.90 to $14.15 (highest broker) Tracking changes for 2023 Upgrades 101 Downgrades 96 (we have noticed the overall trend is down but the CORE stocks are seeing upgrades. It probably reflects the quality stocks in our 30 CORE stocks). |
| Today’s ASX sector Movements Best – IT +1% Worst – Consumer Staples -1.2% |
| Core Watchlist Index (changes since last Not So) The CORE Watchlist is a collection of 30 Australian shares, predominantly “Blue Chip”. We obtain research from up to 6 brokers on each share. Each broker provides a Target Price (value in 12 months) which then provides us with an average for each stock. We then compare that average to the current price as a percentage. IE Macquarie price $176.95 Av. Target Price $205.96= 85.9% (meaning 14.1% upside over next 12 months) + income 4.35% (including franking). To get the CORE Index we take the average across the 30 stocks. This provides us with a market average as there are up to 80 teams of analysts providing the research and target prices. The CORE Watchlist stocks represent more than 55% of the ASX 200 and so provide us with a good indicator of the market value. When it’s at 100% then the market is fully priced. We have seen that when the index is below 90%, then it’s good buying, but that doesn’t happen very often. Should you have any questions, please let me know. The Core index increased from 93.30% to 94.85%. Overall Earnings Per Share (EPS) FY23 increased from 4.79% to 4.82% FY24 decreased from 10.3% to 10.04% Most expensive – Woolworths (WOW) 109.6% CBA 109.5% Least expensive – Lend Lease 77.6% (currently up 11% this month). The CORE Watchlist has 9 (8) stocks trading above 100%, they are BHP CBA COL JBH RIO SHL TCL WES WOW, lowest number ever is 0, highest 9. While 3 (6) are trading below 85% (highest 18) lowest for a while is 3. LLC NEC STO (Figures in brackets is last Not So). Stocks trading below all broker forecasts are as follows; (it has been a handy indicator in the past). 7 out of the 30 CORE stocks are trading below the lowest broker target price. Highest 24. Lowest for some time 7. ALL current price $37.05 Broker range $41.20 to $43 ANZ current price $23.77 Broker range $25.00 to $31 CSL current price $302.18 Broker range $315 to $350 LLC current price $8.11 Broker range $8.32 to $14.45 ORA current price $3.47 Broker range $3.50 to $3.80 STO current price $7.25 Broker range $8.30 to $12 WBC current price $22.09 Broker range $22.50 to 30 Added Removed CPU NXT |
| Banking Index Like the CORE Watchlist index, the Banking index is the four major banks’ average target price based on research from up to 6 brokers. The percentage below 100% is the potential upside over the next 12 months (not including income). If at or over 100%, then this indicates the Banks are fully priced. The Banking index increased from 93.4% to 95.8%, mainly due to the decreased target prices noted above. Based on today’s bank prices, the table below shows the estimated dividends (c) and yield. The expectation is for increased dividend payments and still very attractive yields. PLUS FRANKING. |
| Other Indicators (changes since last Not So) – US VIX Index increased from 19.08 to 19.09 Trading range is likely to be 17-28. Over the last 25 years, market bottoms have seen VIX reach a minimum of 48. Seems the market is settled with the outlook. – Iron Ore increased from $117.80 to $119.60 Was below $80 in November, but the reopening of CHINA has seen a strong rally. ALL-TIME HIGH of $237.57. Av expected for 2023 is $104.20 – Copper increased from $4.00 to $4.06 China re-opening and shortage expected in 2023. It hit an ALL-TIME HIGH $5.03 at the start of the Russian invasion. – Gold decreased from $2031 to $2030. near 1 year high. Record high $2063. – AUD/USD decreased from 67c to 66.96c. – USD/CNY decreased from $6.89 to $6.88 Lowest $6.31 Highest in recent years $7.35 – Asian markets – DOWN. – US 10 year Bonds increased from 3.28% to 3.41%. Rates are reducing on an expectation of slowing economy & potential rate cuts. 4.23% (8 year high). US 30 year Bond increased from 3.56% to 3.64% The highest level was 4.27%. US Federal Reserve peak maybe lower than 5.4% to 5.50%, currently 5%. The US 2 year rate has decreased from 3.74% to 3.98% (5.08%, highest since 2006). The gap between the 2 yr and 10 years an inverse -0.57%. It was -0.46% but still inverted, which historically has suggested a recession. Widest inverse gap is -1.1%. This is the most it has been inverted in 42 years. – German Bonds increased from 2.19% to 2.37%. 2.74% highest since 2008 – Japanese Bonds remained at 0.47% 0.508% highest in many years. Widening the range to 0.5% Japan had the highest inflation read for 40 years. The Bank of Japan chair is changing. Will this change their low-interest rate policy? – Aussie Bonds 10 year Bonds increased from 3.19% to 3.28%. Recent high is 4.21% – Other Aussie Bonds 1 year 3.24% 2 year 2.97% 4 year 3% 5 year 3.04% 15 year Bonds 3.54%. The yields have reduced after the RBA pause. – Oil prices increased from $80.16 to $82.94. OPEC announced production cuts of 1.2m barrels. This spooked the market, that energy inflation may return. At this levels not really an issue, but if it moves to $95 then it could cause more issues – Tungsten – Baltimore & Rotterdam remained at $340 – $345 mtu. China $325 to $340mtu. |
| This week & next week Last “Not So” opened in 5 Aust states (excl NT Tas ACT), US 6 states (California, Massachusetts Colorado New York South Carolina & Arkansas) and Sweden Contact details PO BOX 149 Deniliquin NSW 2710 125 End St Deniliquin NSW 2710 Ph. 03 58950100 Fax 03 58950101 Mobile 0412113524 scottm@provincialwealth.com.au kevinh@provincialwealth.com.au chrisp@provincialwealth.com.au maddyl@provincialwealth.com.au |

Regardless of where you are in Australia, we offer you the best financial planning and advisory services. Feel free to call us today with any question you may have.

People, Big Picture Framework, Quality Services and Value for Money!
We are strong believers in integrity, honesty, professionalism and respect! Our aim is to foster healthy relationships with our clients that last a lifetime.