| The Not So DAILY BULLETIN 10 February 2023 No.537 |
| Top Stories |
| Friday, February 10 2023, saw the ASX 200 fall 56 points to close at 7434. The high of 7558 last Friday might be the top of this rally (for a while) as the market awaits Australian company profits (next three weeks) and the US inflation figure on Wednesday (Tuesday US time). We have previously outlined several headwinds affecting markets. Some of these have turned in cross winds (China re-opening and Europe energy crisis averted). The tailwind is job creation, low unemployment and consumer spending. Rising interest and inflation rates historically cause job losses, unemployment, and less spending. To date, this has yet to be shown in economic data (which can be a lagging indicator), so many expect this to occur in the coming months. However, a couple of interesting observations might make this time different (I’m always nervous about this time being different, and it generally turns out not to be). 1. In the US and Australia, there are more job vacancies than unemployed. On this measure, there shouldn’t be any unemployed. There is a skills shortage; if someone lost their job and had skills, they would likely have another job soon. Companies are reluctant to put off workers as if the economy has a mild slowdown and then picks up again; it will be even harder to find workers. 2. COVID government spending (handouts) has allowed consumers to have more cash reserves than before the pandemic. This means they have funds to keep spending or meet increased mortgage payments. 3. Plenty of 2nd job opportunities. Unlike the recession of 1991, there is a lot of part-time work for those who need extra cash to pay bills and mortgage payments. 4. Consumers represent 65-75% of the economy. If unemployment remains low, people have jobs and income, allowing spending to remain. The question is, will there be spending reductions (especially the mortgage belt), which has a knock effect on companies and profits, and for how long will this occur? I’m still cautious about the market as it has been rallying on little fundamental evidence. |
| Investment market outlook AMP’s Shane Oliver provided his end of week assessment of markets – 2023 is likely to see easing inflation pressures, central banks moving to get off the brakes and economic growth weakening but probably avoiding deep recessions. This along with improved valuations should make for better returns in 2023. But there are likely to be bumps on the way – particularly regarding central banks and inflation, recession risks, geopolitical risks and raising the US debt ceiling around the September quarter. – Global shares are expected to return around 7%. The post mid-term election year normally results in above average gains in US shares, but US shares are likely to remain a relative underperformer compared to non-US shares reflecting still higher price to earnings multiples. The $US is also likely to weaken further which should benefit emerging and Asian shares. – Australian shares are likely to outperform again, helped by stronger economic growth than in other developed countries (albeit RBA rates hikes may threaten this) and ultimately stronger growth in China supporting commodity prices and as investors continue to like the grossed-up dividend yield of around 5.5%. Expect the ASX 200 to end 2023 at around 7,600. So far its looking like it might be too conservative. – Bonds are likely to provide returns a bit above running yields, as inflation slows and central banks become less hawkish. – Unlisted commercial property and infrastructure are expected to see slower returns, reflecting the lagged impact of weaker share markets and last year’s rise in bond yields on valuations. – Australian home prices are likely to fall another 8% or so as rate hikes continue to impact, resulting in a top to bottom fall of 15-20%, but with prices expected to bottom around the September quarter, ahead of gains late in the year as the RBA moves toward rate cuts. Ongoing RBA rate hikes risk a bigger fall in prices though. – Cash and bank deposits are expected to provide returns of around 3.25%, reflecting the back up in interest rates through 2022. – A rising trend in the $A is likely over the next 12 months, reflecting a downtrend in the overvalued $US, the Fed moving to cut rates and solid commodity prices helped by stronger Chinese growth. – Eurozone shares fell 1.2% on Friday, playing catch up to the previous day’s fall in the US, but the US S&P 500 rose 0.2%. ASX 200 futures were flat pointing to a flat start to trade for the Australian share market on Monday. |
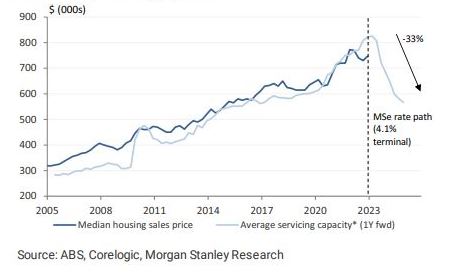
| Interest rates & housing This week the RBA released the minutes from the last meeting. They have increased the inflation forecasts, which has seen several economists adjust their peak interest rate forecast. Morgan Stanley is 4.1%, AMP 3.6%, Citigroup 3.85%, and UBS 3.6% but the risk of higher, CBA 3.85% and the outlier Morgans 4.85%. All forecasts have been raised higher as inflation has remained higher and job creation has continued to be strong. The cash rate is at 3.35%. There are likely to be two more to 3.85%., but 4.1% or higher can’t be ruled out. It is very much data-dependent. The RBA expects inflation to fall to 4.3% by the end of the year. The unknown question is? How fast will inflation fall from 4% to the RBA target of 2-3%? AMP’s Shane Oliver thinks it will happen quickly. However, others suggest inflation will be sticky and remain higher for longer. If inflation falls, as Shane suggests, it allows the RBA to cut rates. But if inflation remains stubbornly above 3% into 2024, then the RBA won’t cut rates in 2023. Higher for long rates will affect other assets, especially leveraged ones (property). Morgan Stanley illustrated this with the two graphs below. Exhibit 2 – shows mortgage repayments to increase to the highest point since 2007 (as % of income). Exhibit 1 – shows the median house price has dipped to around $750k (dark blue line). However, it’s the light blue line. This is of more interest. The light blue represents the average borrowing capacity or the amount the bank will lend. Higher rates mean banks will lend less for the same income. Morgan Stanley suggests borrowing capacity will drop overall by 33% to around $570k. If rates are held up for longer, then the median house price will likely come closer to this number, as the price paid by the average buyer is determined by the letter from the bank and not cash in the pocket. |
 |
| Exchange Traded Funds (ETF) – series Our preference is to use ETFs with a smart beta system (where available). A smart beta ETF has rules (criteria) regarding the selection of investments. The fourth ETF profiled is an existing option that has performed well over the years and continues to be an important theme. 4. iShares Global Healthcare ETF (IXJ) gives investors exposure to a diversified portfolio of global biotechnology, healthcare, medical equipment and pharmaceuticals. At 3rd February 2023 the fund holds 114 stocks, the Price to Earnings (PE) is 22.57 times, and the Dividend Yield is 1.17%. Return on Equity 29.50%. Current top 10 holdings Company, Country, Industry, % of Fund United Health, USA, Healthcare and Insurance, 6.65 Johnson and Johnson, USA, Medical devices, pharmaceuticals and consumer goods, 6.09 Merck, USA, Medicines, vaccines, biologic therapies, animal health, 3.88 Eli Lilly, USA, Medication, drugs and vaccines, 3.87 Abbvie, USA, Biotechnology, 3.72 Pfizer, USA, Medicines and vaccines, 3.53 Novo Nordisk, Denmark, Pharmaceuticals specifically diabetes, 3.21 Thermo Fisher, USA, Instruments, consumables and software, 3.19 Roche, Switzerland Pharmaceuticals and diagnostics, 3.11 Novartis, Switzerland, Innovative medicines, generics and eyecare, 3.07 Summary Global Health is a sector that is likely to outperform over the long term as science and technology discover improvements for an ageing world population. Performed well during COVID (after finding the vaccine). High Return on Equity (ROE). CSL number 21, Sonic Health number 106 in the fund. Previously reviewed 1. Global Value (VLUE) 2. International Quality (QUAL) & hedged currency (QHAL) 3. International Small Company Quality ETF (QSML) |
| Reporting Season Company profit reporting starts again. I’ve outlined below when the CORE watchlist stocks are reporting 7/2 Transurban (TCL) – strong result. Dividend up 38%. Inflation linked tolls 8/2 Amcor (AMC) – slight increase in dividend. Flat result. Passed inflation costs to users. 13/2 JB Hi Fi (JBH) Lend Lease (LLC) 14/2 Computershare (CPU) CSL 15/2 CBA Orora (ORA) Wesfarmers (WES) 16/2 Goodman Group (GMG) Sonic Health (SHL) Origin Energy (ORG) 21/2 BHP Coles (COL) 22/2 Rio Tinto (RIO) Santos (STO) Woolworths (WOW) 23/2 NextDC (NXT) 24/2 Brambles (BXB) 27/2 Woodside (WDS) |
| Financial Planning Snippets – PHONE financial fraud. We are aware of a number of examples of fraud being committed by people ringing. PLEASE DO NOT GIVE YOUR BANK DETAILS OR CREDIT CARD NUMBER to a person who has RUNG YOU. – The work test for those over 67 is removed from July 1. Meaning you can be retired and make further super contributions (if appropriate). – Commonwealth Seniors Health Care card has seen the income limit increase to $144k(couple) $90k (single). If you are of Age Pension age and don’t have the card, please let us know. |
| Other Stories (research since last Not So) – |
| Broker Target Price changes – Ord Minnett Ords’ research agreement with JP Morgan ceased. Changing to Morningstar research. New target prices Transurban (TCL) decreased from $13.50 (lowest broker) to $12.50 (still lowest broker) Morgans Amcor (AMC) decreased from $17.75 to $16.20 Macquarie Group (MQG) increased from $214.50 to $222.80 Seek.com (SEK) decreased from $29.40 to $28.90 TCL increased from $13.85 to $14.21 Morgan Stanley AMC decreased from $17.75 to $16.20 MQG increased from $214.50 to $222.80 TCL increased from $13.85 to $14.21 Macquarie AMC decreased from $17.94 to $17.38 TCL increased from $14.19 to $14.51 Wesfarmers (WES) increased from $43.50 to $46.20 Bell Potter/Citigroup UBS MQG increased from $190 to $211 Tracking changes for 2023 Upgrades 37 Downgrades 36 |
| Today’s ASX sector Movements Best – Consumer Staples +0.9% Worst – IT -2% |
| Core Watchlist Index (changes since last Not So) The CORE Watchlist is a collection of 30 Australian shares, predominantly “Blue Chip”. We obtain research from up to 6 brokers on each share. Each broker provides a Target Price (value in 12 months) which then provides us with an average for each stock. We then compare that average to the current price as a percentage. IE BHP price $38.56 Av. Target Price $39.73= 97.1% (meaning 2.9% upside over next 12 months) + income 7.11% (including franking). To get the CORE Index we take the average across the 30 stocks. This provides us with a market average as there are up to 80 teams of analysts providing the research and target prices. The CORE Watchlist stocks represent more than 55% of the ASX 200 and so provide us with a good indicator of the market value. When it’s at 100% then the market is fully priced. We have seen that when the index is below 90%, then it’s good buying, but that doesn’t happen very often. Should you have any questions, please let me know. The Core index decreased from 93.88% to 92.59%. Overall Earnings Per Share (EPS) FY22 decreased from 21.14% to 21.12% (this includes some stocks using CY21). FY23 increased from 5.09% to 5.16% The next few weeks with the profit season will provide some more guidance regarding profit forecasts Most expensive – CBA 119.3% Least expensive – Santos 73.1% The CORE Watchlist has 8 (8) stocks trading above 100%, they are BHP CBA COL JBH NAB RIO WES WOW, lowest number ever is 0, highest for a while 9. While 7 (6) are trading below 85% (highest 18). CPU LLC NEC NXT ORA ORG STO (Figures in brackets is last Not So). Stocks trading below all broker forecasts are as follows; (it has been a handy indicator in the past). 10 out of the 30 CORE stocks are trading below the lowest broker target price. Highest 24. Lowest for some time 8. ALL current price $35.90 Broker range $40.50 to $43 CPU current price $24.73 Broker range $26.50 to $40.25 CSL current price $304.96 Broker range $312.20 to $354 LLC current price $8.30 Broker range $8.74 to $14.45 NXT current price $10.13 Broker range $10.34 to $14.90 ORA current price $2.92 Broker range $3.25 to $3.95 ORG current price $7.06 Broker range $7.83 to $9 SHL current price $28.78 Broker range $31.30 to 35.05 STO current price $6.95 Broker range $8.30 to $12 TLS current price $4.07 broker range $4.15 to $4.75 Added Removed |
| Banking Index Like the CORE Watchlist index, the Banking index is the four major banks’ average target price based on research from up to 6 brokers. The percentage below 100% is the potential upside over the next 12 months (not including income). If at or over 100%, then this indicates the Banks are fully priced. The Banking index increased from 100.8% to 100.9% – fully priced above 100%. However CBA 119%, NAB 102.1% WBC 89.4% ANZ 91.8%. Based on today’s bank prices, the table below shows the estimated dividends (c) and yield. The expectation is for increased dividend payments and still very attractive yields. PLUS FRANKING. FY 22 % FY 23 % FY 24 % ANZ 146.0 5.68% 157.5 6.13% 162.8 6.33% CBA 385.0 3.50% 433.7 3.94% 451.5 4.11% NAB 150.2 4.74% 173.0 5.46% 176.2 5.56% WBC 125.0 5.24% 144.8 6.08% 150.0 6.29% MQG 622.0 3.25% 675.6 3.53% 674.0 3.52% Updated to include 2024 for BHP and RIO. Yields are still expected to be very strong. The forecasts below are for the full year. FY22 cps % FY23 cps % FY24 cps % BHP 451.00 9.40% 308.40 6.43% 295.2 6.15% RIO 696.67 5.68% 692.50 5.65% 673.0 5.49% Plus franking. Please note RIO is Calendar Year (CY). Cents per share (CPS). |
| Other Indicators (changes since last Not So) – US VIX Index increased from 19.43 to 20.53 Trading range is likely to be 17-28. Over the last 25 years, market bottoms have seen VIX reach a minimum of 48. We are still waiting for this event! – Iron Ore increased from $123 to $123.05 Was below $80 in November, but the reopening of CHINA has seen a strong rally. ALL-TIME HIGH of $237.57. Av expected for 2023 is $102.50 – Copper decreased from $4.04 to $4.02. China re-opening and shortage expected in 2023. It hit an ALL-TIME HIGH $5.03 at the start of the Russian invasion. – Gold decreased from $1887 to $1876. Climbed above $2000 at the start of the Russian invasion. Record high $2063. – AUD/USD decreased from 69.33 to 69.16c. – USD/CNY increased from $6.78 to $6.80. Lowest $6.31 Highest in recent years $7.35 – Asian markets – DOWN – US 10 year Bonds increased from 3.61% to 3.74%. Rates are bouncing around. 4.23% (8 year high). US 30 year Bond increased from 3.66% to 3.83% The highest level was 4.27%. US Federal Reserve likely to peak at 5.1% to 5.25%, currently 4.75%. Plus BOND selling of $95bn per month (QT). The US 2 year rate has increased from 4.42% to 4.53% (4.88%, highest since 2007). The gap between the 2 yr and 10 years an inverse -0.78%. It was -0.81% but still inverted, which historically has suggested a recession. Widest inverse gap is -0.83%. This is the most it has been inverted in 42 years. – German Bonds increased from 2.29% to 2.36%. 2.44% highest in eight years – Japanese Bonds increased from 0.495% to 0.5% 0.508% highest in many years. Widening the range to 0.5% Japan had the highest inflation read for 40 years. The Bank of Governor selected, may change the low interest policy? – Aussie Bonds 10 year Bonds increased from 3.60%to 3.80%. Recent high is 4.21% – Other Aussie Bonds 1 year 3.64% 2 year 3.55% 4 year 3.54% 5 year 3.58% 15 year Bonds 4.04%. The yields moved up again 0.20% over the last couple of days on interest rate and inflation expectations and the curve is very flat. – Oil prices increased from $74.79 to $79.76. Russia announced cutting production by 500,000 barrels – Tungsten – Baltimore & Rotterdam increased from $335-$338 mtu to $340 – $345 mtu. China increased from $325-$335mtu to $325 to $340mtu. |
| This week & next week Last “Not So” opened in 5 Aust states (excl NT Tas ACT), US 3 states (California, Massachusetts Colorado) Sweden & Israel This week – Preparing and presenting February reviews Next week – Preparing and presenting February reviews Contact details PO BOX 149 Deniliquin NSW 2710 125 End St Deniliquin NSW 2710 Ph. 03 58950100 Fax 03 58950101 Mobile 0412113524 scottm@provincialwealth.com.au kevinh@provincialwealth.com.au chrisp@provincialwealth.com.au maddyl@provincialwealth.com.au |

Regardless of where you are in Australia, we offer you the best financial planning and advisory services. Feel free to call us today with any question you may have.

People, Big Picture Framework, Quality Services and Value for Money!
We are strong believers in integrity, honesty, professionalism and respect! Our aim is to foster healthy relationships with our clients that last a lifetime.