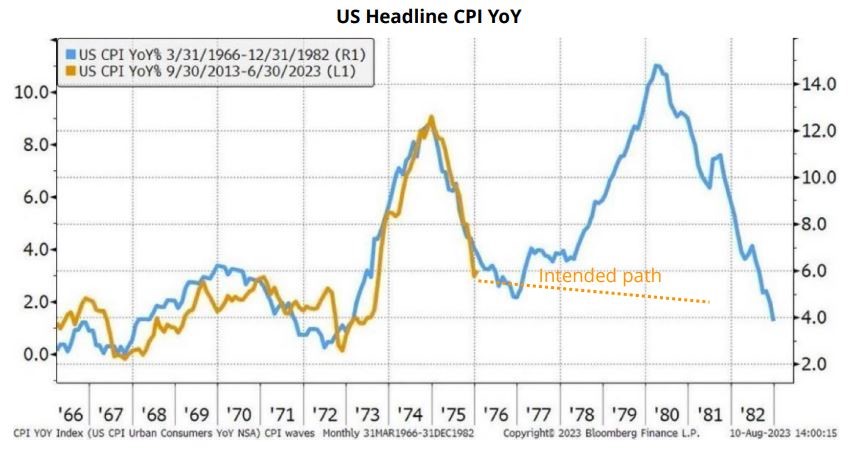
| The Not So DAILY BULLETIN 17 October 2023 No.590 Top Stories Tuesday, 17 October 2023, the ASX 200 gained 30 points to finish at 7056. Still at the lower end of the trading range of 7000 to 7500 that the market has been in for most of the year. I’ve read two different views saying we are still in the Bear Market rally (Morgan Stanley) and another one (Bell Potter Coppo report) saying last week is the one-year anniversary of the new bull market. Please take a look at the chart below. The truth probably lies somewhere in between; unfortunately, only hindsight confirms it. Shane Oliver is suggesting we may have seen the bottom, and while the US inflation figures were a little higher than expected, the market took them reasonably well. The Middle East continues to be a problem for markets, especially the energy market, but it’s probably sabre-rattling unless it spreads outside of Gaza. The US has bought some insurance by doing an oil deal with Venezuela regarding more oil supply. The RBA minutes released today suggested the last meeting nearly raised rates. This has led to Bond rates increasing again and puts a high chance of a rate rise on Melbourne Cup day. The start of US 3rd quarter profit season has started well, with the big banks delivering better than expected profits. This will indicate whether the interest rate increases have affected profit margins and slowed consumer demand. We expect to see a choppy market that will likely grind higher over the coming weeks and months. WE ARE STILL CAUTIOUS in the short term but markets likely see a pick-up towards the end of the year. Selective about the areas we like. We are happy for you to share our Not So Daily Bulletin with family and friends, and if we can help them, we are also happy to chat. AND This week marks five years of PROVINCIAL WEALTH. Thank you for your continued support!  Have we seen the bottom? Over the weekend, AMP’s Shane Oliver penned the following – Was that it? Have we seen the bottom in shares? The rebound in share markets from their recent lows after falls of around 8% is impressive given the wall of worries around Israel, US politics, recession risk, share market valuations, China, etc. However, it is consistent with several key positives: – First, shares had become oversold technically and had fallen to levels of technical support (in particular, the 200 day moving average for the US S&P 500) that can attract buying interest. – There are reports that China is considering expanding its budget deficit by issuing 1 trillion (or $A214bn) for infrastructure spending. This sounds over the top (as it would be 5.6% of GDP) and may not eventuate. But its possible something is on the way. Of course, fiscal stimulus is no panacea for China’s structural problems but it would provide a near term boost. – The upcoming US profit reporting season may also provide a boost given the tendency for results to surprise on the upside. Fourth, and most importantly numerous US Fed speakers have moved to acknowledge the tightening in financial conditions from the rise in bond yields which are “going to do some of the work for us.” This suggests that as things stand now the Fed will leave rates on hold in November. While the “high for longer” rates message remains in place the Fed seems to have shifted from being happy to just let bond yields keep rising to now acknowledging the tightening they bring. This in turn removes some of the upside pressure on bond yields which reduces a key worry we had in terms of share market valuations. – The risk of a further leg down or re-test of the lows in global and Australian shares remains high though. – So far the rally has lacked the breadth often seen out of major bottoms and sentiment was not washed up at the low, the upside surprise in US inflation in September will keep the Fed on edge, share valuations remain stretched without a further fall in bond yields, the risk of recession remains high, uncertainty remains high around the China’s economy and property markets, the US remains at high risk of a shutdown next month and the risk of an escalation to involve Iran in the Israeli conflict which would directly threaten oil supplies is high. So, the ride for shares is likely to remain volatile. – …but several things should help shares by year end: seasonality will start to become positive from mid-October; inflation is likely to continue to fall which should take pressure of central banks allowing them to ease through next year; and any recession is likely to be mild. So, while near term uncertainties remain high our 12-month view on shares remains positive. US inflation US inflation on Friday night was slightly higher than expected at 0.4% monthly and +3.7% yearly. The Core CPI gained +0.32%, translating into a +4.1% yearly gain. The graph below shows the four areas of US inflation. 1. Services inflation (blue) remains consistently higher and stronger. This is a genuine concern for Central Banks. 2. Food inflation (gold) is starting to reduce. 3. Energy (red) has a deflationary effect, but this could change with the volatility in the oil price. 4. Goods inflation has disappeared as the effects of COVID and supply chains have disappeared. Betashares chief economist David Bassanese suggests that if the market can absorb the current inflation rate and with the global backdrop of concerns from Israel and Ukraine, interest rates might have peaked on both the official rates and the Bond market. However, a peak in rates doesn’t indicate that rate cuts are on the agenda anytime soon, as Central Bankers are still concerned that inflation could have the ability to kick up again, as was seen in the 1970s, as illustrated in the 2nd graph below.   Financial Planning Snippets – Super Guarantee (SGC) for employees increases to 11% from 1/7/23 – Commonwealth Seniors Health Care card has seen the income limit increase to $144k(couple) $90k (single). If you are of Age Pension age and don’t have the card, please let us know. – Account Based Pension minimum pension payments will revert back to normal from July 2023 (from half normal, which were put in place due to COVID in 2020). Other Stories – SEC announce 2.7c quarterly dividend. Trade ex-div 19/10. Dividend based on $2.14 NTA. SP $1.86. Yield 5.8% plus franking. Broker Target Price changes – Ord Minnett BHP increased from $39.50 (lowest broker) to $41 (still lowest broker) Rio Tinto (RIO) increased from $107 (lowest broker) to $111 (still lowest broker) South 32 (S32) decreased from $4.10 to $3.90 Morgans Morgan Stanley Rio Tinto (RIO) decreased from $135 (highest broker) to $134.50 (still highest broker) Macquarie Telstra (TLS) decreased from $4.39 to $4.14 (lowest broker) Bell Potter/Citigroup UBS Tracking changes for 2023 Upgrades 290 Downgrades 274 (we have noticed the overall trend is down, but the CORE stocks are seeing upgrades. It probably reflects the quality of stocks in our 30 CORE stocks). Today’s ASX sector Movements Best – IT +1.3% Worst – Healthcare -1.2% Core Watchlist Index (changes since last Not So) The CORE Watchlist is a collection of 30 Australian shares, predominantly “Blue Chip”. We obtain research from up to 6 brokers on each share. Each broker provides a Target Price (value in 12 months) which then provides us with an average for each stock. We then compare that average to the current price as a percentage. IE Macquarie price $176.95 Av. Target Price $205.96= 85.9% (meaning 14.1% upside over next 12 months) + income 4.35% (including franking). To get the CORE Index we take the average across the 30 stocks. This provides us with a market average as there are up to 80 teams of analysts providing the research and target prices. The CORE Watchlist stocks represent more than 55% of the ASX 200 and so provide us with a good indicator of the market value. When it’s at 100% then the market is fully priced. We have seen that when the index is below 90%, then it’s good buying, but that doesn’t happen very often. Should you have any questions, please let me know. The Core index decreased from 89.94% to 89.18%. This is usually a good BUYING signal when the CORE index is below 90% Overall Earnings Per Share (EPS) We could see an uptick in overseas company earnings (BHP MQG CSL RIO STO WDS RMD AMC BXB) as they will benefit from a lower current assumption. We have been using 70c. Moved to 68c (still conservative). FY23 increased from 3.32% to 3.36% mainly currency FY24 increased from 7.50% to 7.71% mainly currency Most expensive – CBA 111.2% Least expensive – Lend Lease 54.5% The CORE Watchlist has 5 (5) stocks trading above 100%; they are; BHP CBA JBH NAB WES, lowest number ever is 0, highest 9. While 9 (7) are trading below 85% (highest 18), while the lowest is 5. CSL LLC NEC NXT ORA RMD S32 SHL STO (Figures in brackets is last Not So). STOCKS TRADING BELOW ALL BROKER FORECASTS ARE AS FOLLOWS; (it has been a handy indicator in the past). 10 out of the 30 CORE stocks are trading below the lowest broker target price. Highest 24. Lowest for some time 5. ALL current price $39.64 Broker range $42.80 to $46.50 CSL current price $236.40 Broker range $325 to $340 LLC current price $6.76 Broker range $8.03 to $14.45 MQG current price $168.60 Broker range $175 to $209 ORA current price $2.60 Broker range $3.00 to $4.10 ORI current price $15.58 Broker range $16.23 to $19.50 RMD current price $22.16 Broker range $27.70 to $39 SHL current price $29.69 Broker range $32 to $38 STO current price $7.70 Broker range $8.10 to $12.30 TLS current price $3.88 Broker range $4.20 to $4.75 Added Removed Banking Index (changes since last Not So) Like the CORE Watchlist index, the Banking index is the four major banks’ average target price based on research from up to 6 brokers. The percentage below 100% is the potential upside over the next 12 months (not including income). If at or over 100%, then this indicates the Banks are fully priced. The Banking index decreased from 102.8% to 102.6%. ANZ cheapest at 95.6% Based on today’s bank prices, the table below shows the estimated dividends (c) and yield. The expectation is slightly increased dividend payments and still very attractive yields. PLUS FRANKING. FY 23 % FY 24 % FY 25 % ANZ 162.8 6.32% 163.7 6.35% 163.7 6.35% CBA 450.0 4.45% 457.7 4.52% 469.5 4.64% NAB 167.3 5.70% 167.5 5.70% 168.0 5.72% WBC 141.3 6.58% 142.2 6.62% 143.2 6.67% MQG 750.0 4.45% 677.0 4.02% 719.2 4.27% Dividend expectations have been cut for BHP and RIO. Yields are still expected to be very strong. The forecasts below are for the full year. I have added FY25. BHP and RIO results will see some changing forecasts with the likelihood of further reduction. FY23 cps % FY24 cps % FY25 cps % BHP 255.00 5.60% 223.17 4.90% 261.8 5.75% RIO 603.17 5.15% 667.00 5.70% 609.0 5.20% Plus franking. Please note RIO is Calendar Year (CY). Cents per share (CPS). Other Indicators (changes since last Not So) – US VIX Index increased from 16.09 to 17.21. The market fears is bouncing around. – Iron Ore decreased from $112.55 to $117.25. ALL-TIME HIGH of $237.57. Av expected for 2023 is $114.1, while dropping to $99.4 for 2024. – Copper decreased from $3.62 to $3.56. – Gold increased from $1892 to $1928 Record high $2063. – AUD/USD decreased from 64.14c to 63.54c. Recent low point 62.9c. – USD/CNY remains at $7.30 Lowest $6.31 Highest in recent years $7.35. – Asian markets – UP – US 10 year Bonds increased from 4.57% to 4.75%. recent high 4.88% (4/10 highest since 2006). The FED maybe on HOLD. US 30 year Bond increased from 4.70% to 4.91%. Hit a 17 year high of 5% last week. US Federal Reserve on hold at 5.5% but maybe more to come in November. The US 2 year rate has increased from 4.99% to 5.11% (5.37%, highest since 2006). The gap between the 2 yr and 10 years an inverse -0.36%. It was -0.42% but still inverted, which historically has suggested a recession. Widest inverse gap is -1.3%. This is the most it has been inverted in 42 years. The gap is narrowing as the long end of the yield curve increases (higher for longer). – German Bonds increased from 2.71% to 2.79%. Hit 3% last week highest since 2008. – Japanese Bonds increased from 0.76% to 0.78% highest in 10 years is 0.804%. – Aussie Bonds 10 year Bonds increased from 4.38% to 4.56%. Recent high 4.67% – Other Aussie Bonds 1 year 4.32% 2 year 4.17% 4 year 4.14% 5 year 4.21% 15 year Bonds 4.81%. Rates have reversed last weeks drop. Seem to be pricing in one more. – Oil prices increased from $84.66 to $86.49. Rumours of US /Venezuela oil deal. – Tungsten – China remains at $305 to $315mtu. EQR in a trading halt (material acquisition). This week & next week Last “Not So” opened in 7 Aust states (excl NT ), US 6 states (California, Massachusetts, Virginia, New York Colorado & South Carolina) & Sweden Contact details PO BOX 149 Deniliquin NSW 2710 125 End St Deniliquin NSW 2710 Ph. 03 58950100 Fax 03 58950101 Mobile 0412113524 scottm@provincialwealth.com.au kevinh@provincialwealth.com.au chrisp@provincialwealth.com.au maddyl@provincialwealth.com.au |

Regardless of where you are in Australia, we offer you the best financial planning and advisory services. Feel free to call us today with any question you may have.

People, Big Picture Framework, Quality Services and Value for Money!
We are strong believers in integrity, honesty, professionalism and respect! Our aim is to foster healthy relationships with our clients that last a lifetime.